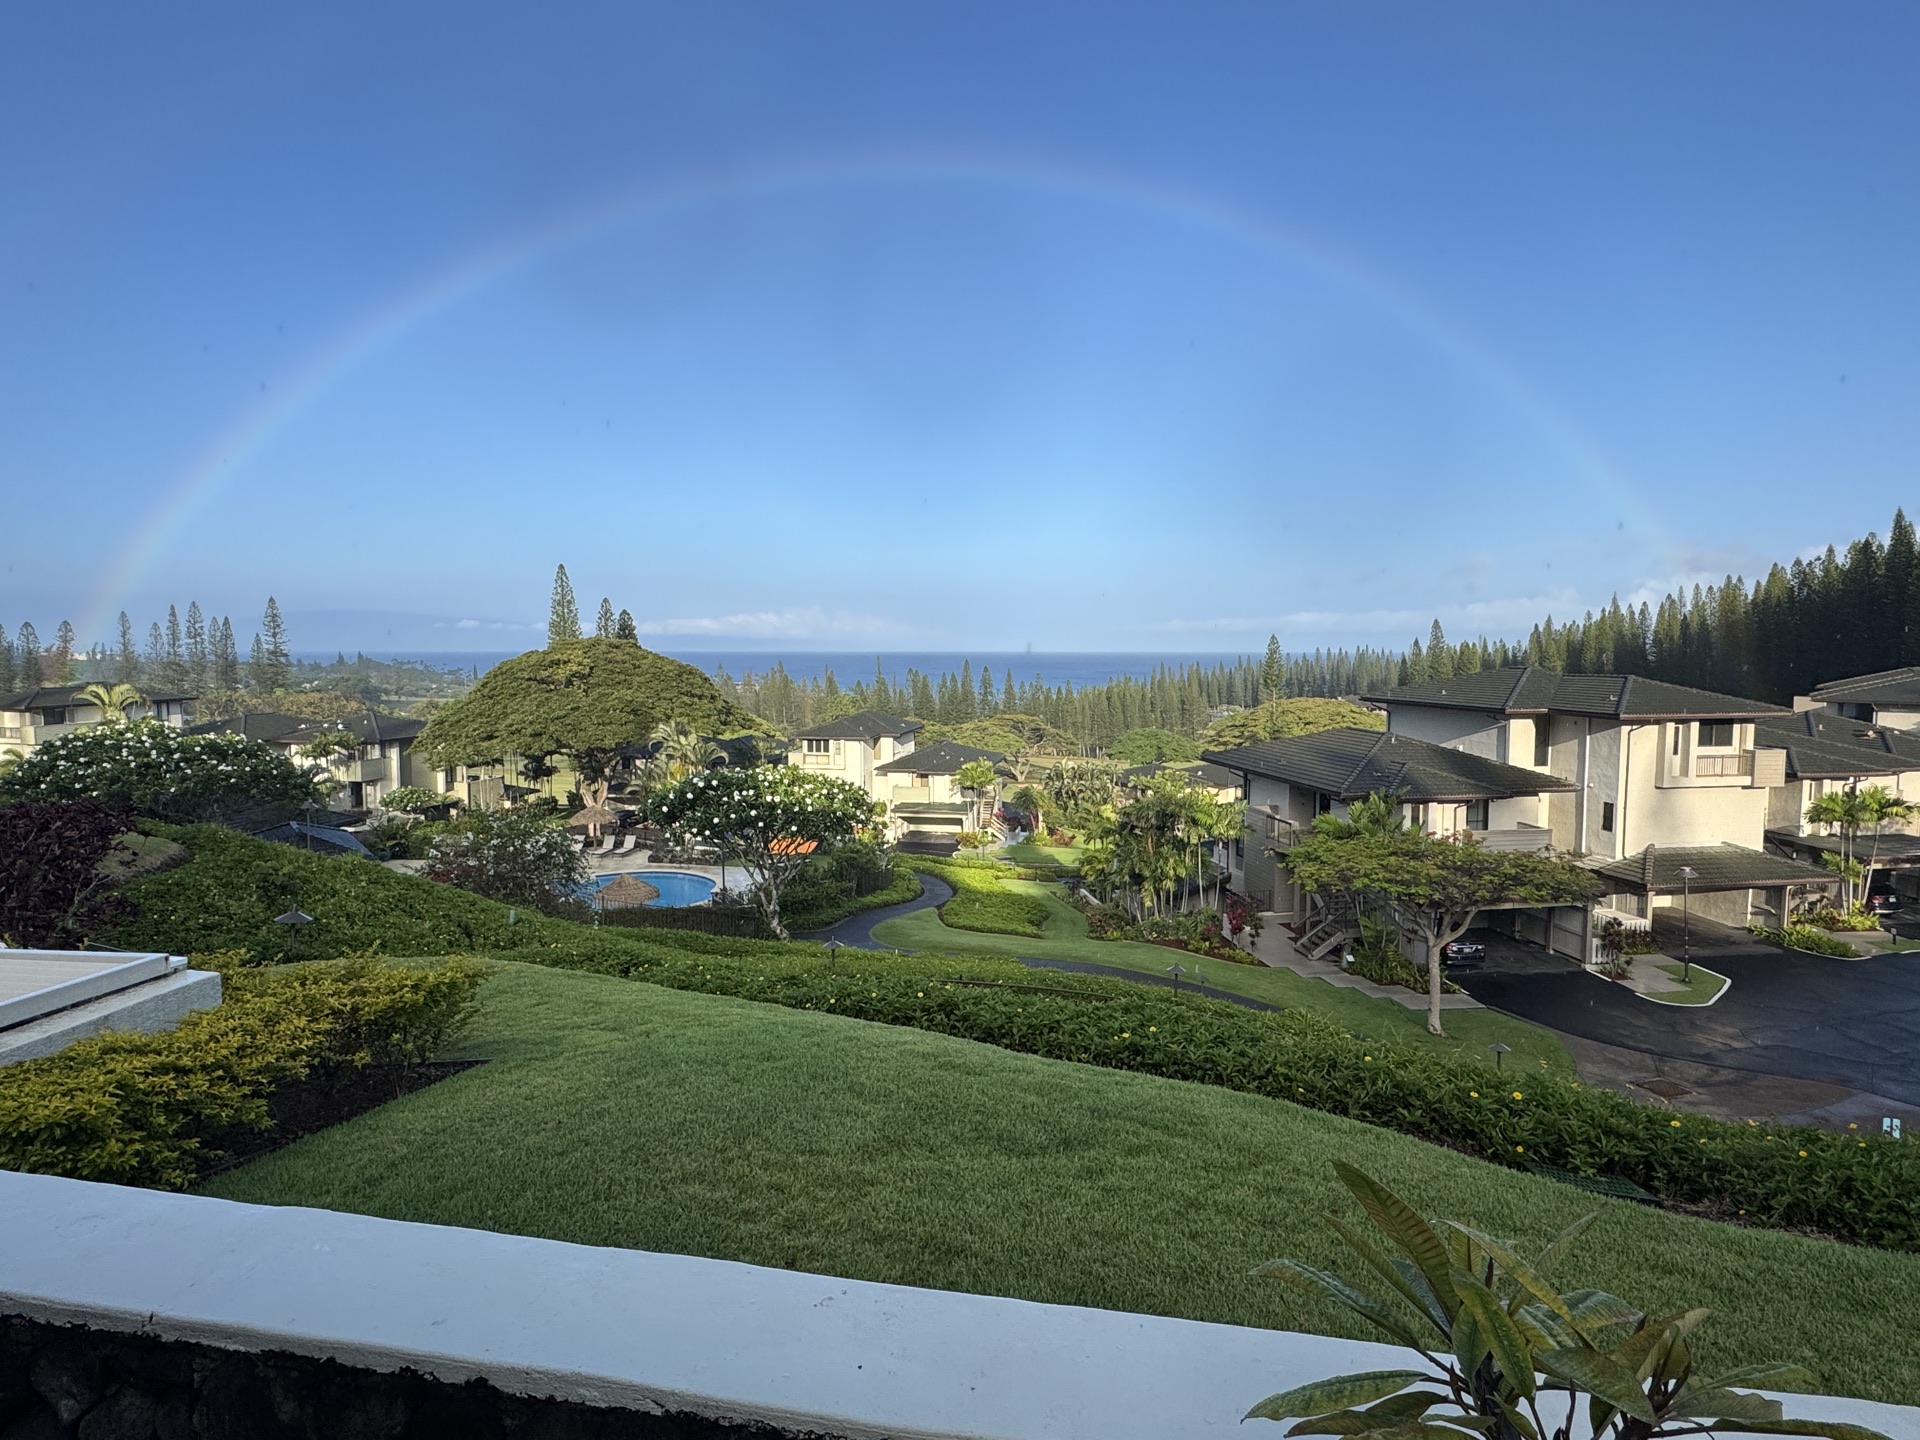
Kapalua Bay Villa · Unit 22 P 3-4
An oceanfront residence.
A proven investment.
Income now, wealth over time, and a place that pays you back twice.
An asset that earns two ways at once.
Income now. Wealth over time. Plus four weeks a year in an oceanfront villa you own outright.
Kapalua sits on the northwest tip of Maui, a stretch of coastline that has been a luxury destination for four decades. The supply of oceanfront villas is fixed, demand is not. That single dynamic is why the underlying asset has averaged just over 6 percent annual appreciation across forty plus years, and closer to 8 percent over the last decade.
The unit opens to a large private lanai with views of both Moloka‘i and Lāna‘i. The resort itself is home to the PGA Tour’s Tournament of Champions, which keeps Kapalua on the calendar of an audience that books oceanfront villas without flinching.
This unit pays for itself from day one. Short-term rental income covers the carrying costs and clears roughly $36,000 per year in net cash flow, while two-week stays twice a year replace another $14,000 in vacation lodging you would otherwise be paying. The property remains cash-flow positive throughout the hold.
Ten years from purchase, the modeling projects the asset at roughly $2.28 million on a 5 percent annual appreciation assumption (which sits below the long-term and recent Maui averages). Combined with cumulative income, that is approximately $1.24 million in total wealth created on the original $1.4 million cash investment.
Two weeks, twice a year in your own oceanfront villa. You own the asset instead of paying someone else.
Positive cash flow from year one, plus long-term appreciation on a supply-constrained island.
Year by year, the asset compounds.
The villa earns its return two ways at once — income (rental revenue plus the lodging you no longer pay for) and appreciation. Counting both, the investment recoups its $1.4M purchase price on a total-return basis in roughly year 12, while remaining cash-flow positive the entire time.
| End of Year | Villa Value | Annual Net Benefit | Cumulative Income | Total Wealth Created |
|---|---|---|---|---|
| Year 1 | $1,470,000 | $35,600 | $35,600 | $105,600 |
| Year 3 | $1,620,675 | $35,600 | $106,800 | $327,475 |
| Year 5 | $1,786,769 | $35,600 | $178,000 | $564,769 |
| Year 7 | $1,969,931 | $35,600 | $249,200 | $819,131 |
| Year 10 | $2,280,452 | $35,600 | $356,000 | $1,236,452 |
Nothing hidden. Every assumption.
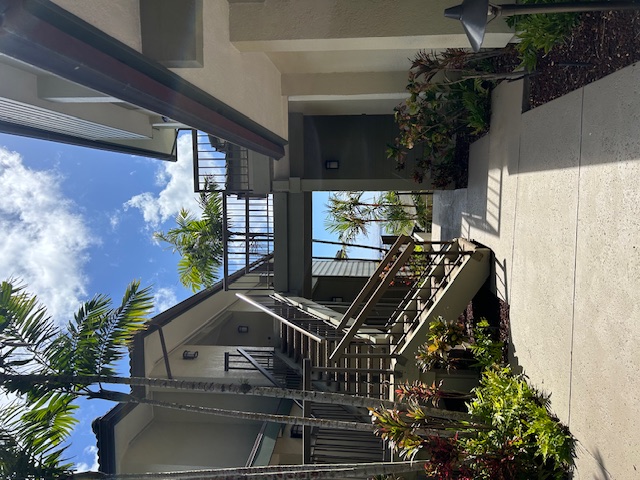
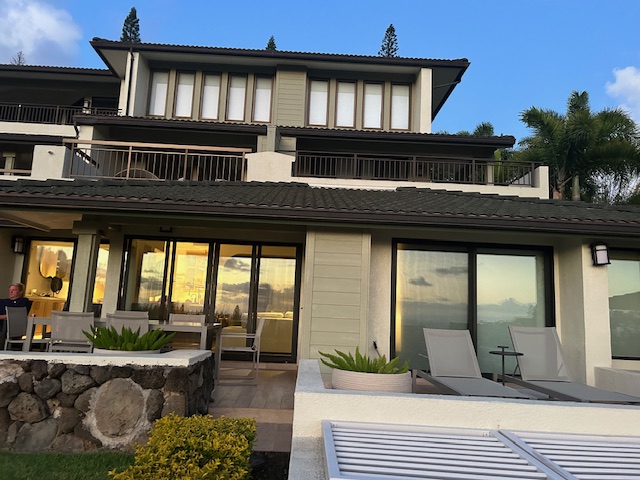
Arrive at the property. Walk to the door.
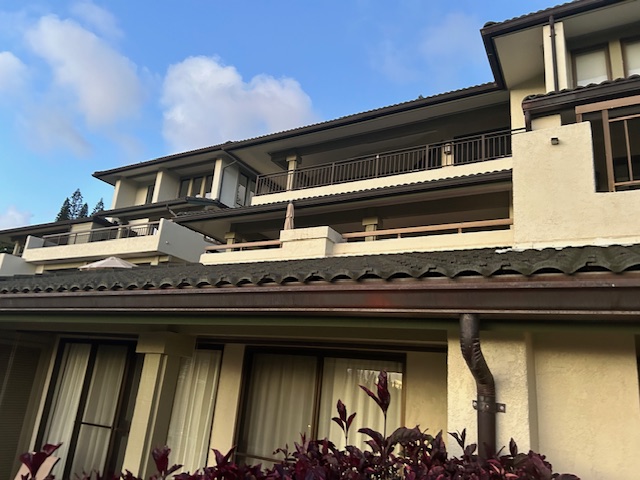
Before the floor plan, before the renovation. This is what every guest sees when they arrive.
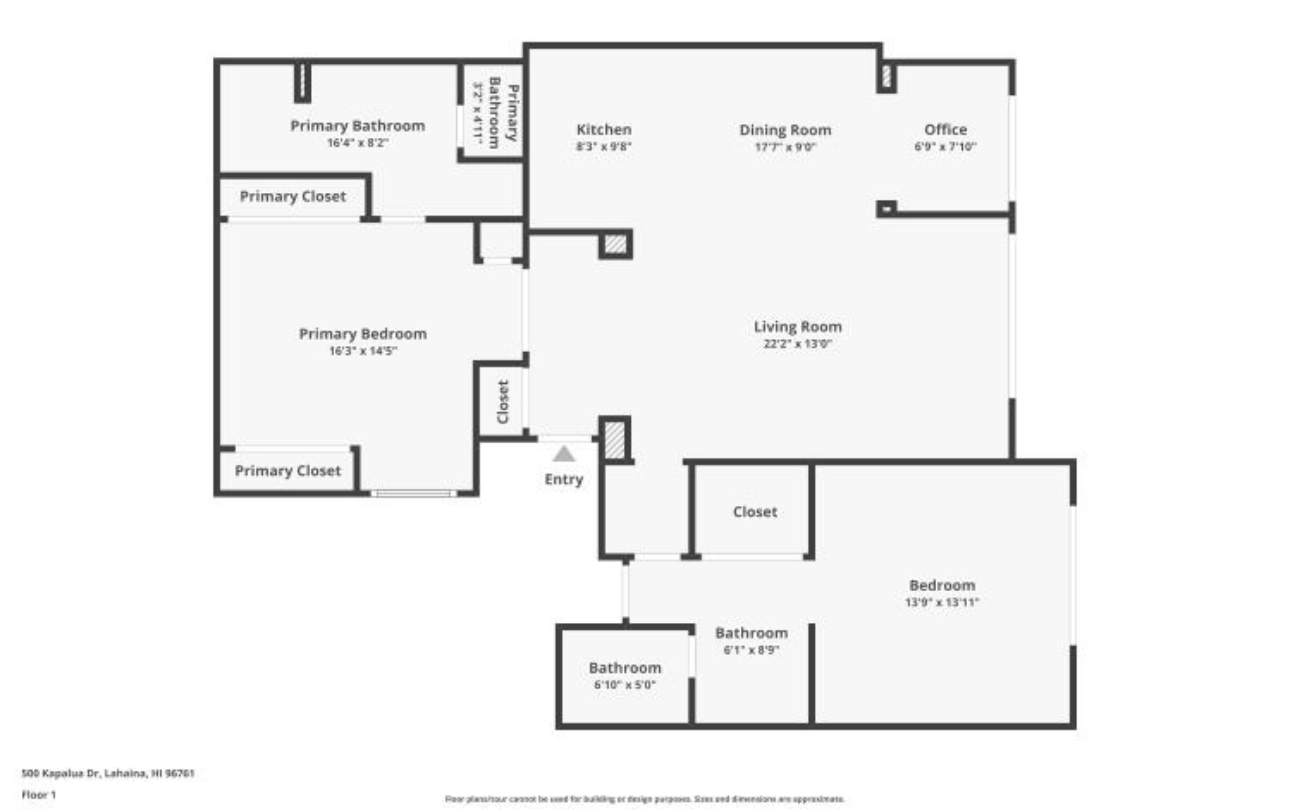
Two bedrooms, two baths. A renovation built around value.
Same footprint as the unit next door. The renovation budget concentrates where it creates the most value: the kitchen, the living spaces, and the sumptuous baths. Bedrooms get new hardwood flooring, ceiling can lights, and a ceiling fan.
Renovation Scope
-
KitchenFull gut. Cabinets, counters, appliances, lighting
-
Living RoomFull finish update, new flooring
-
DiningRefinish, lighting, integrated with living
-
Primary BathFull gut: tile, vanity, shower, fixtures, new flooring
-
Secondary BathFull gut: tile, vanity, fixtures, new flooring
-
Bedrooms (2)Hardwood flooring in place of carpet, plus 4 ceiling can lights and a ceiling fan
-
Whole-Unit FinishesAll ceilings, walls, and trim newly painted. New louvered doors with new hardware throughout
-
Defining ArchesNew arched openings at the foyer into the living room, the alcove in the master bedroom, and from the secondary bath into the second bedroom
-
Hallway CabinetryNew floor-to-ceiling cabinetry in the hallway leading to the secondary bath
-
Custom Closet BuildoutsNew built-in closet systems with light oak millwork and brass hardware
-
Lanai (440 sq ft)Full flooring tear-out and replace. The lanai is a primary lifestyle and rental selling point, with views of Moloka‘i and Lāna‘i
-
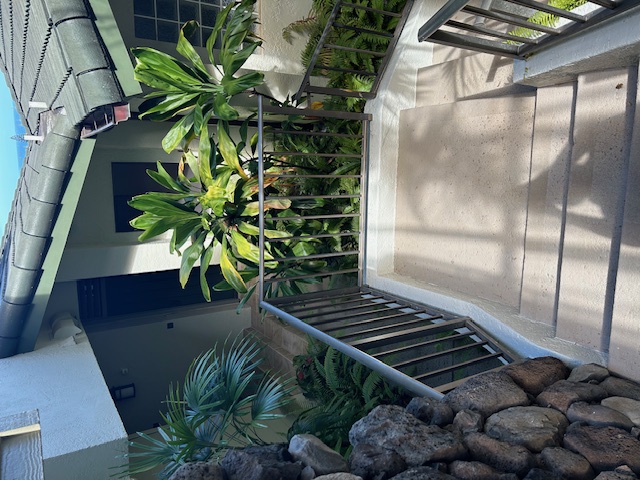
Front StepsExisting flooring removed and replaced; first impression for every guest
The unit we’re buying. The unit next door that proves it.
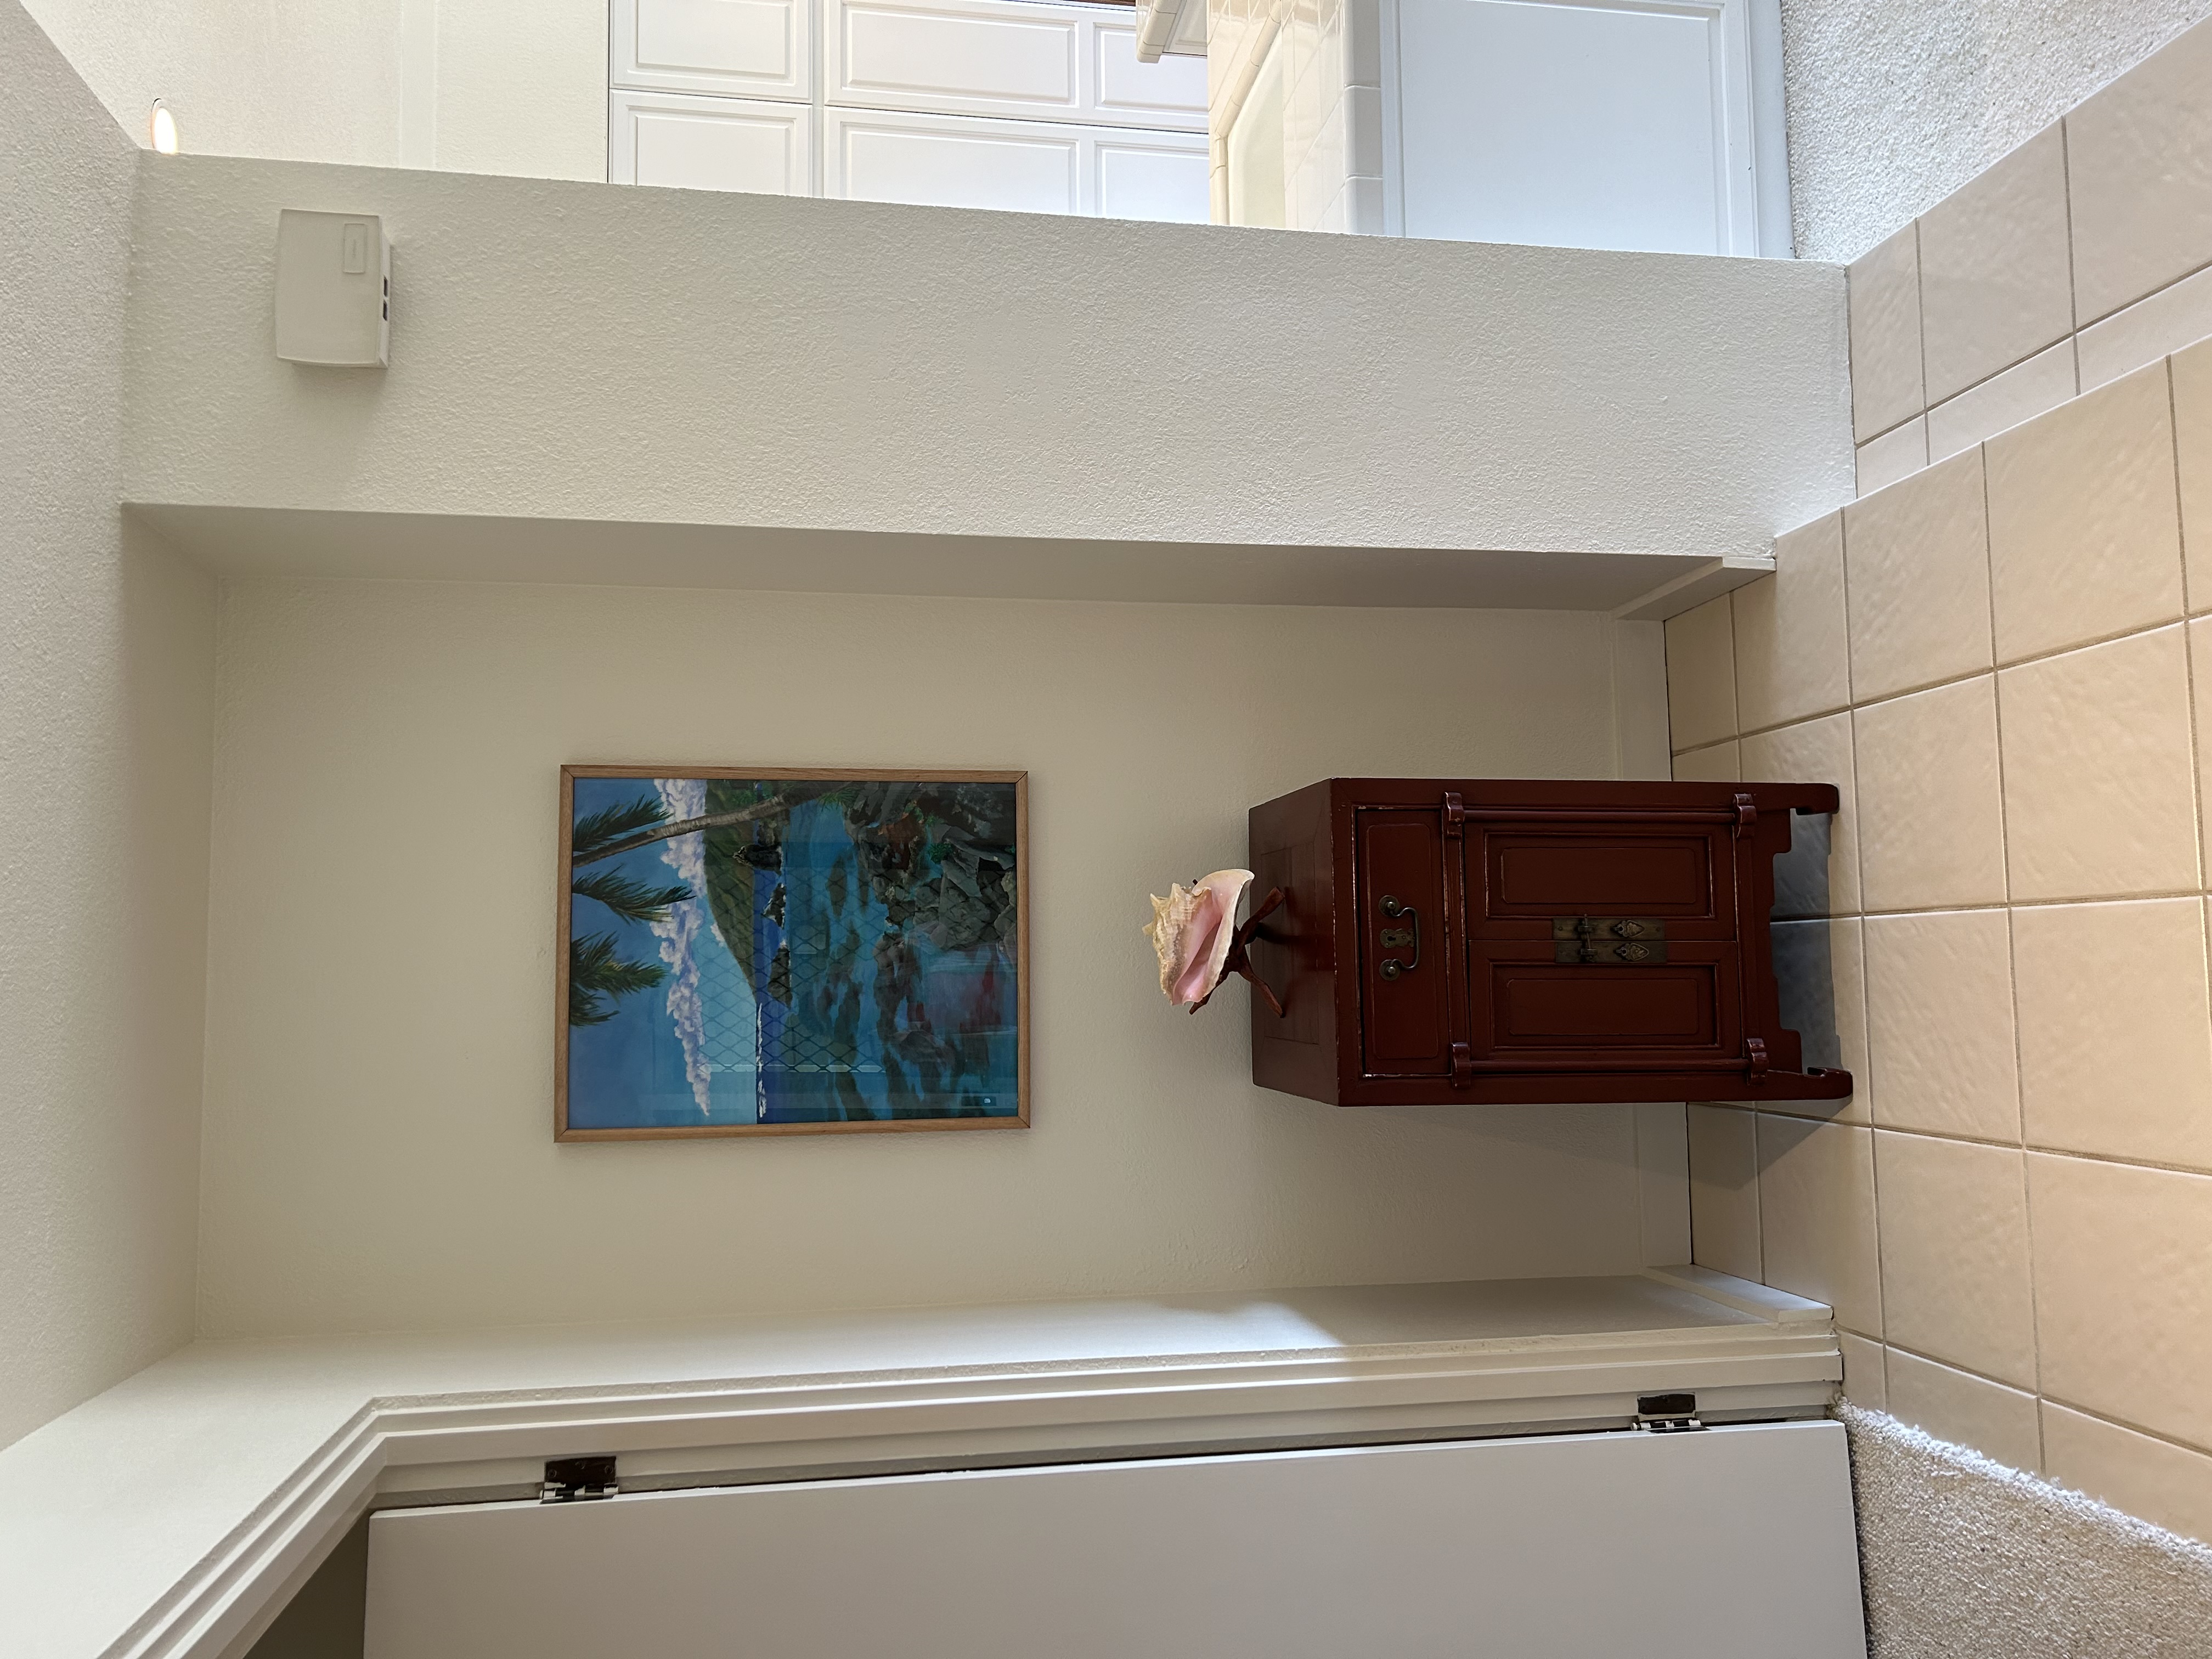
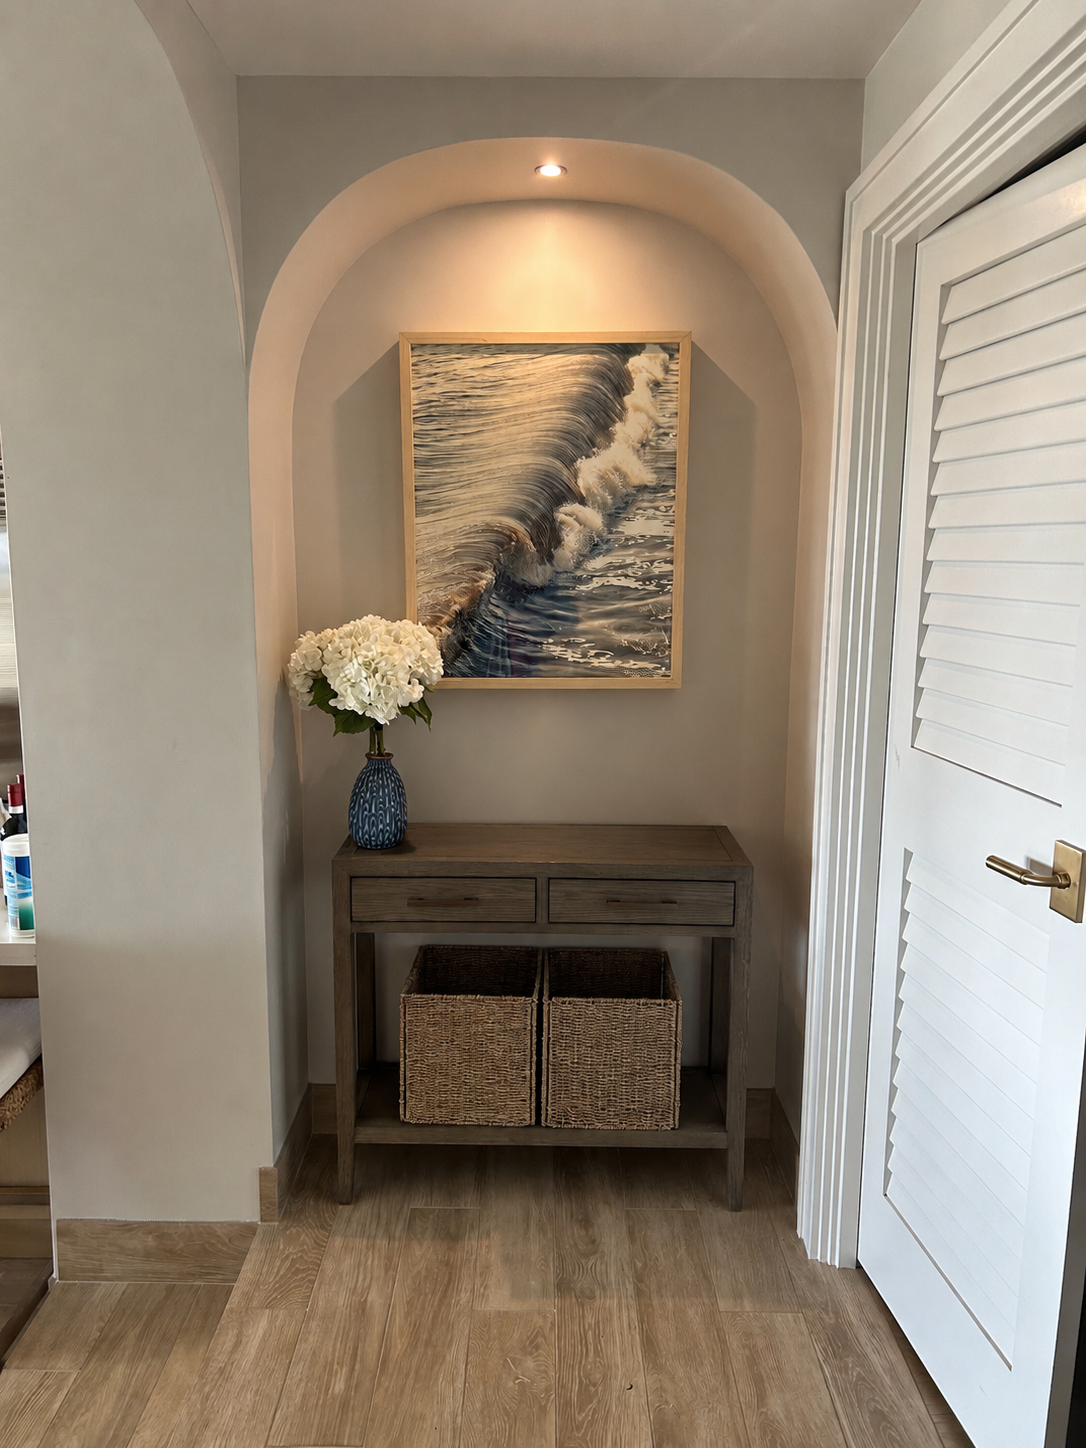
Unit 22 P 3-4 is dated. The unit directly next door has already been fully renovated. Same building, same view of the Pacific, same floor plan, just flipped. It’s the after picture for the before we’re acquiring.
The Approach
The Living Spaces
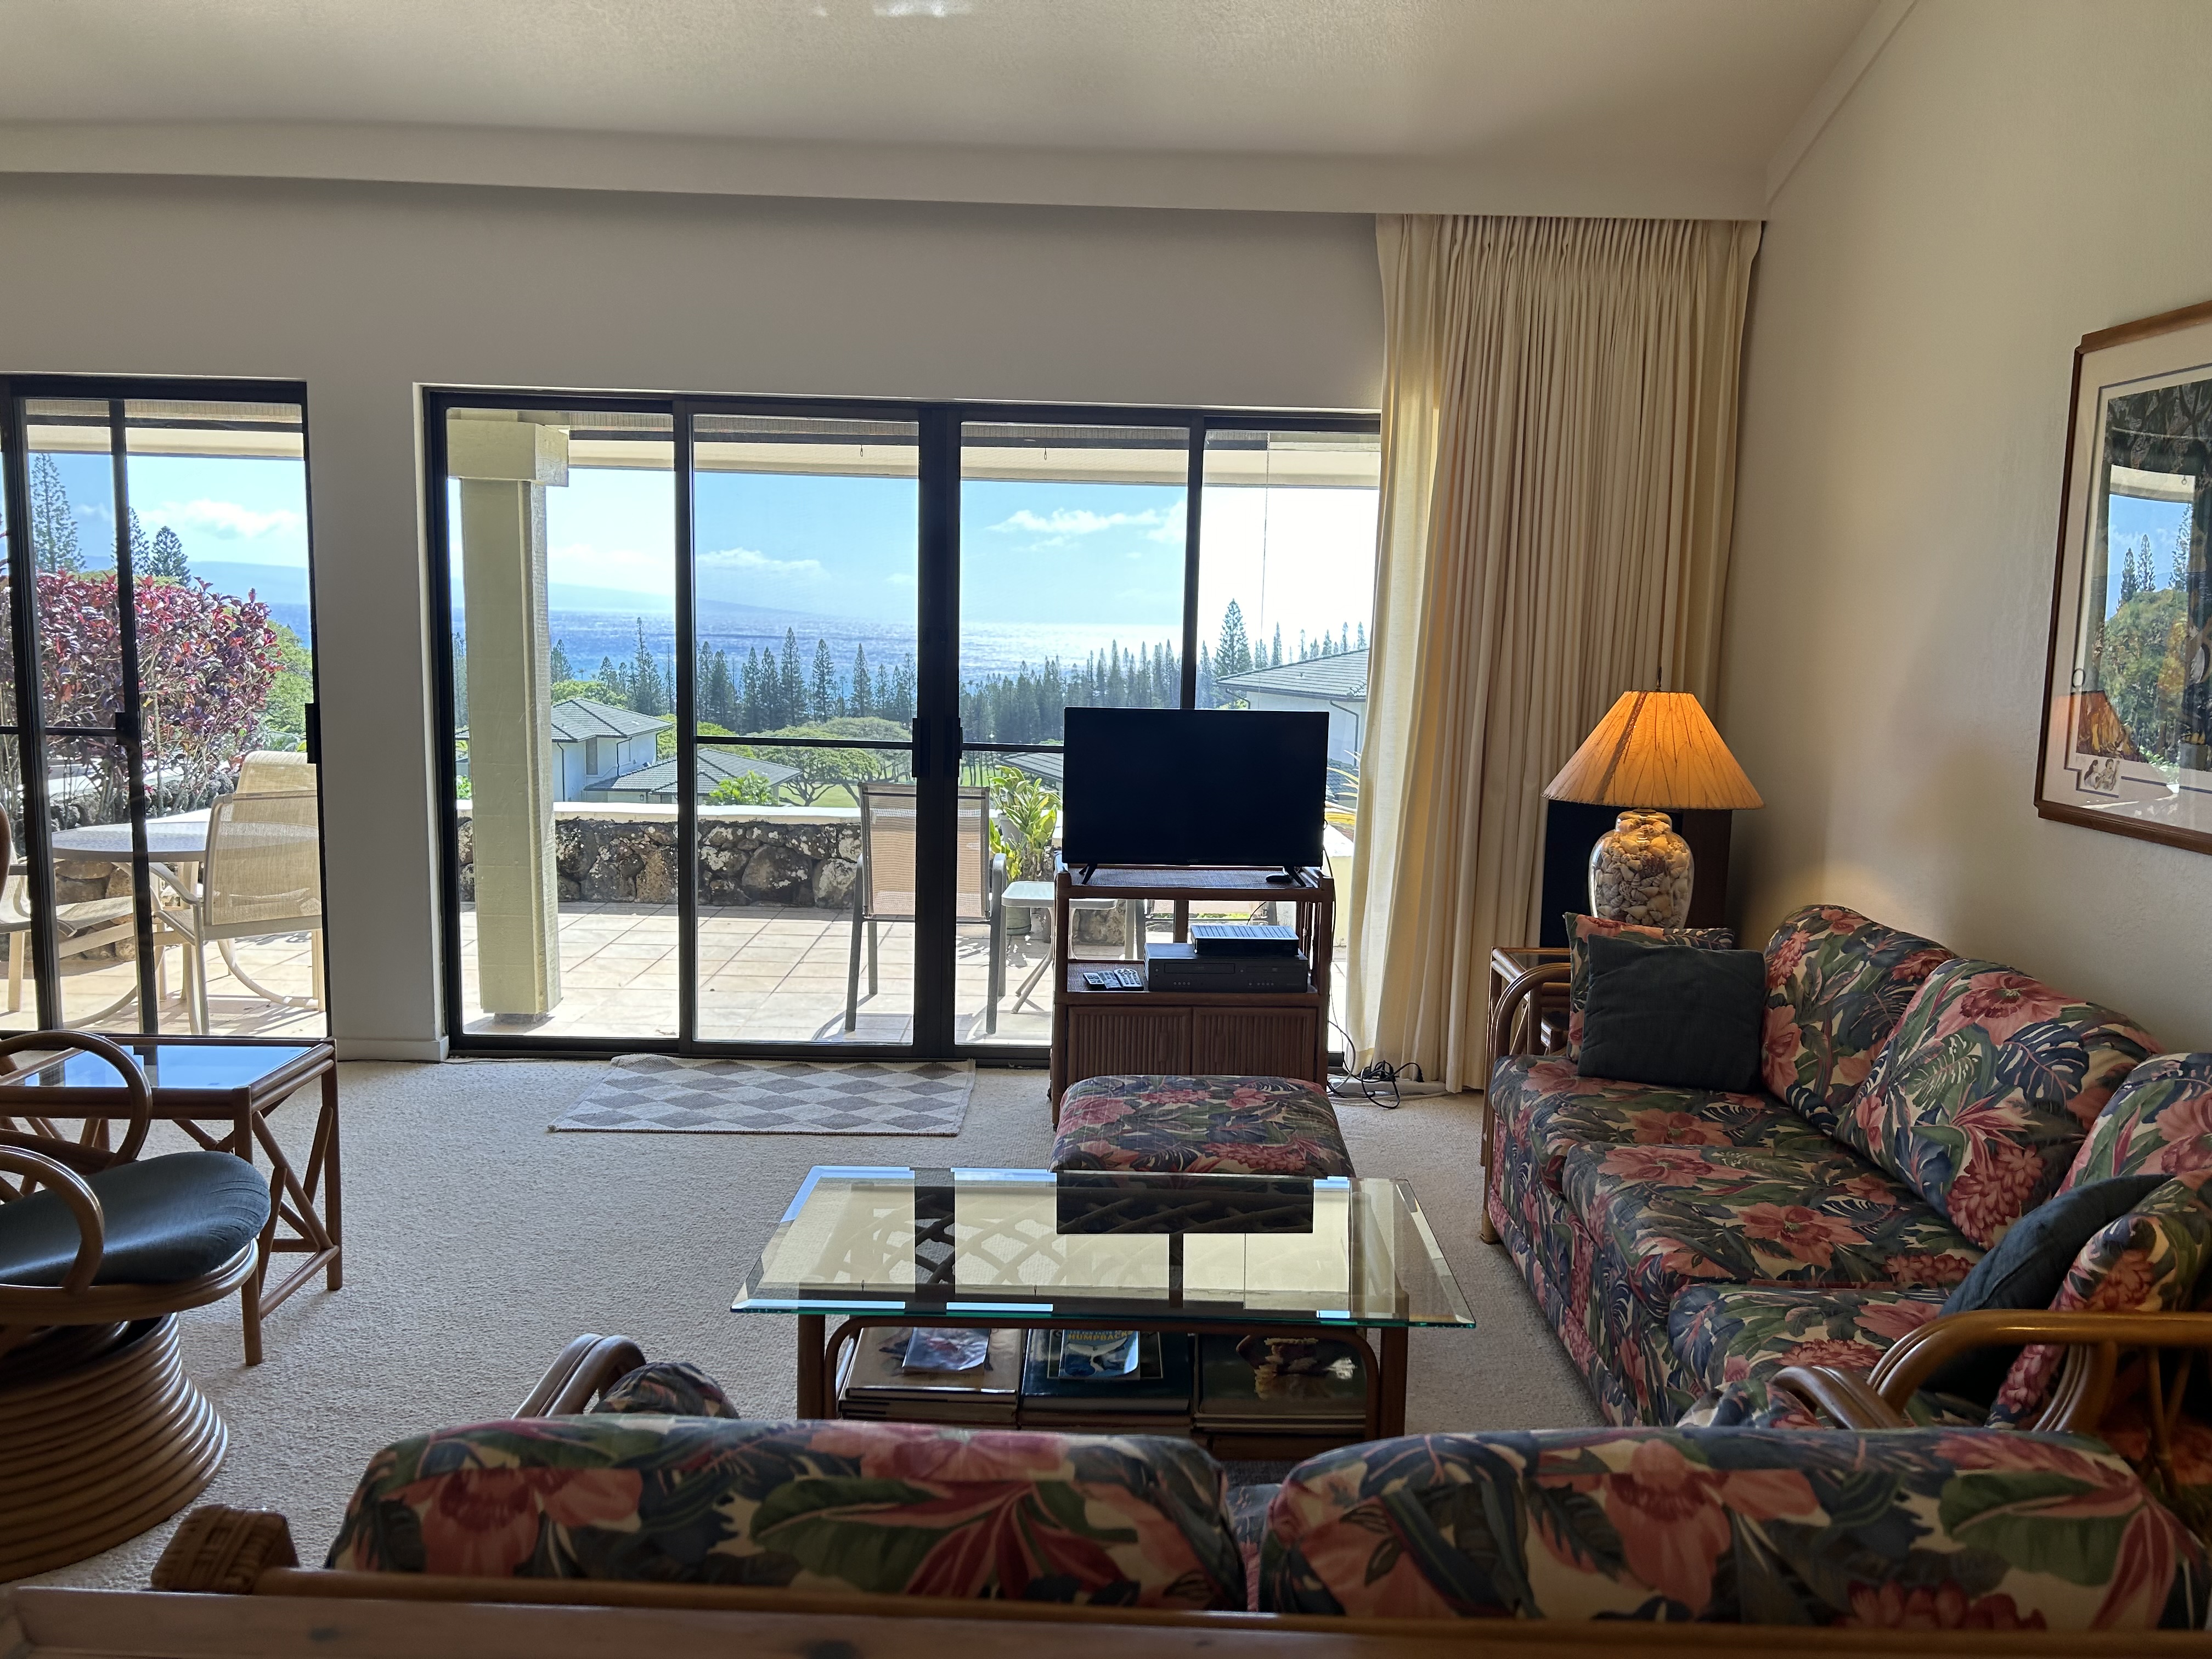
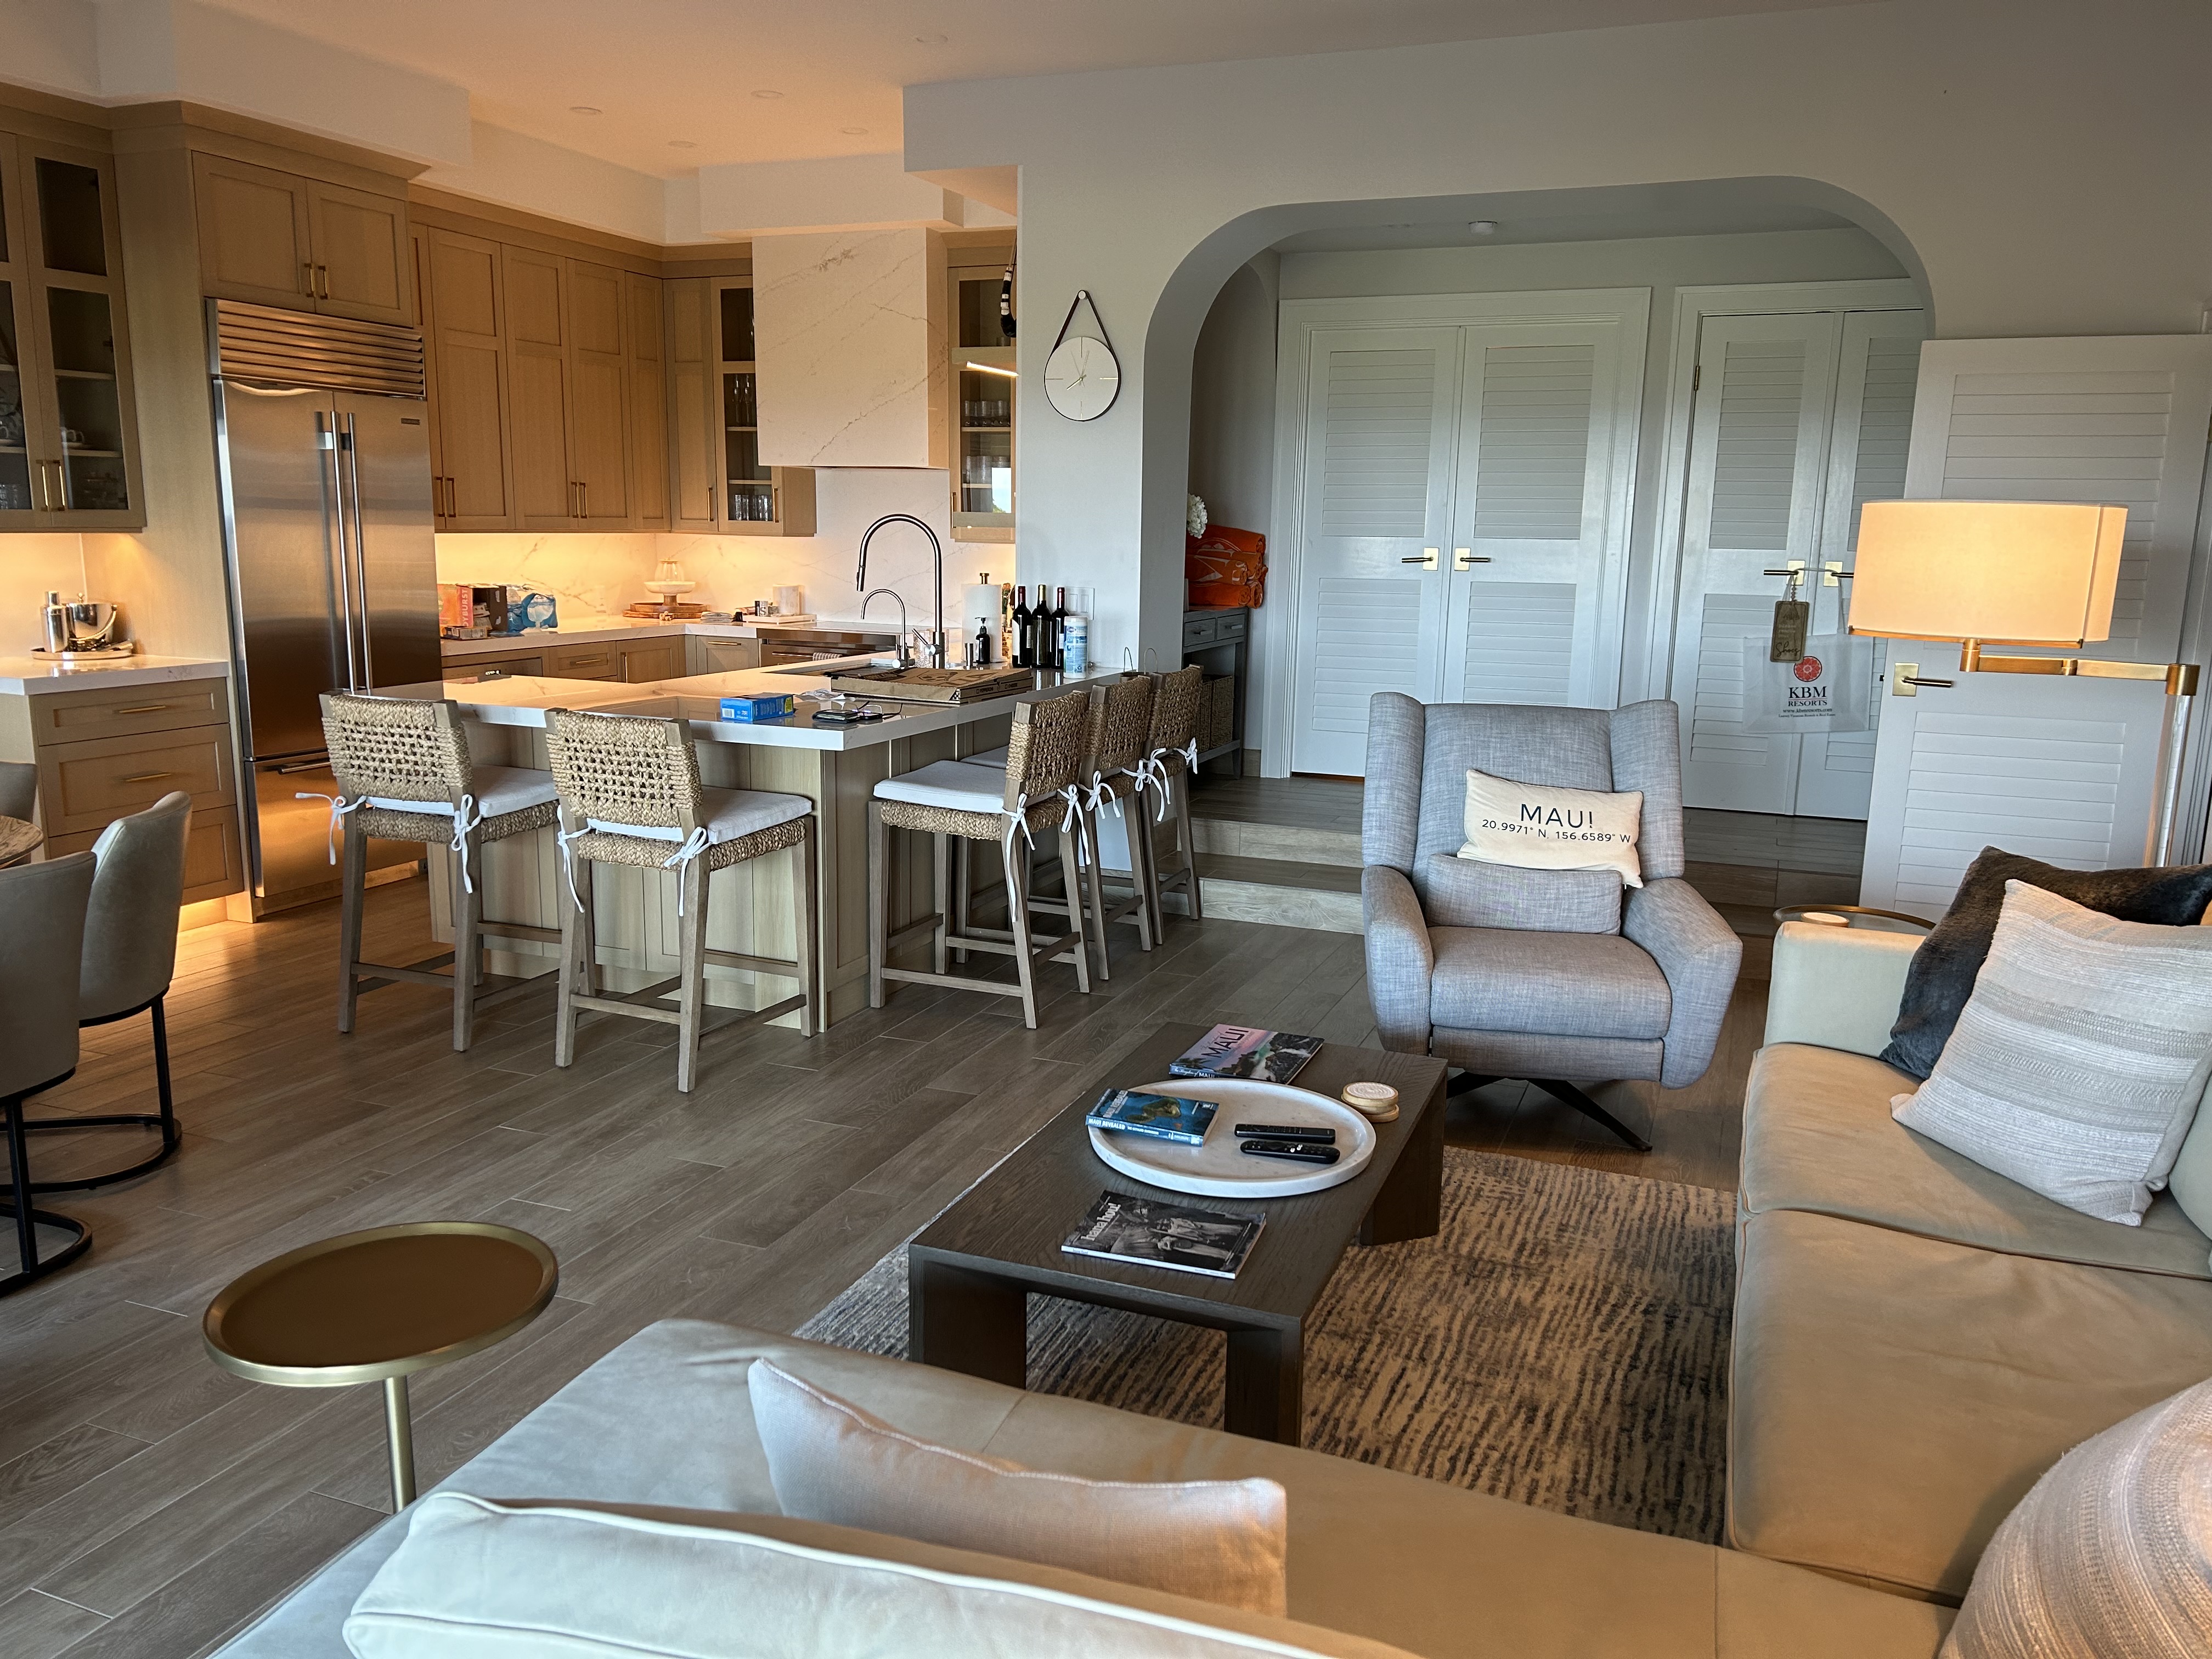
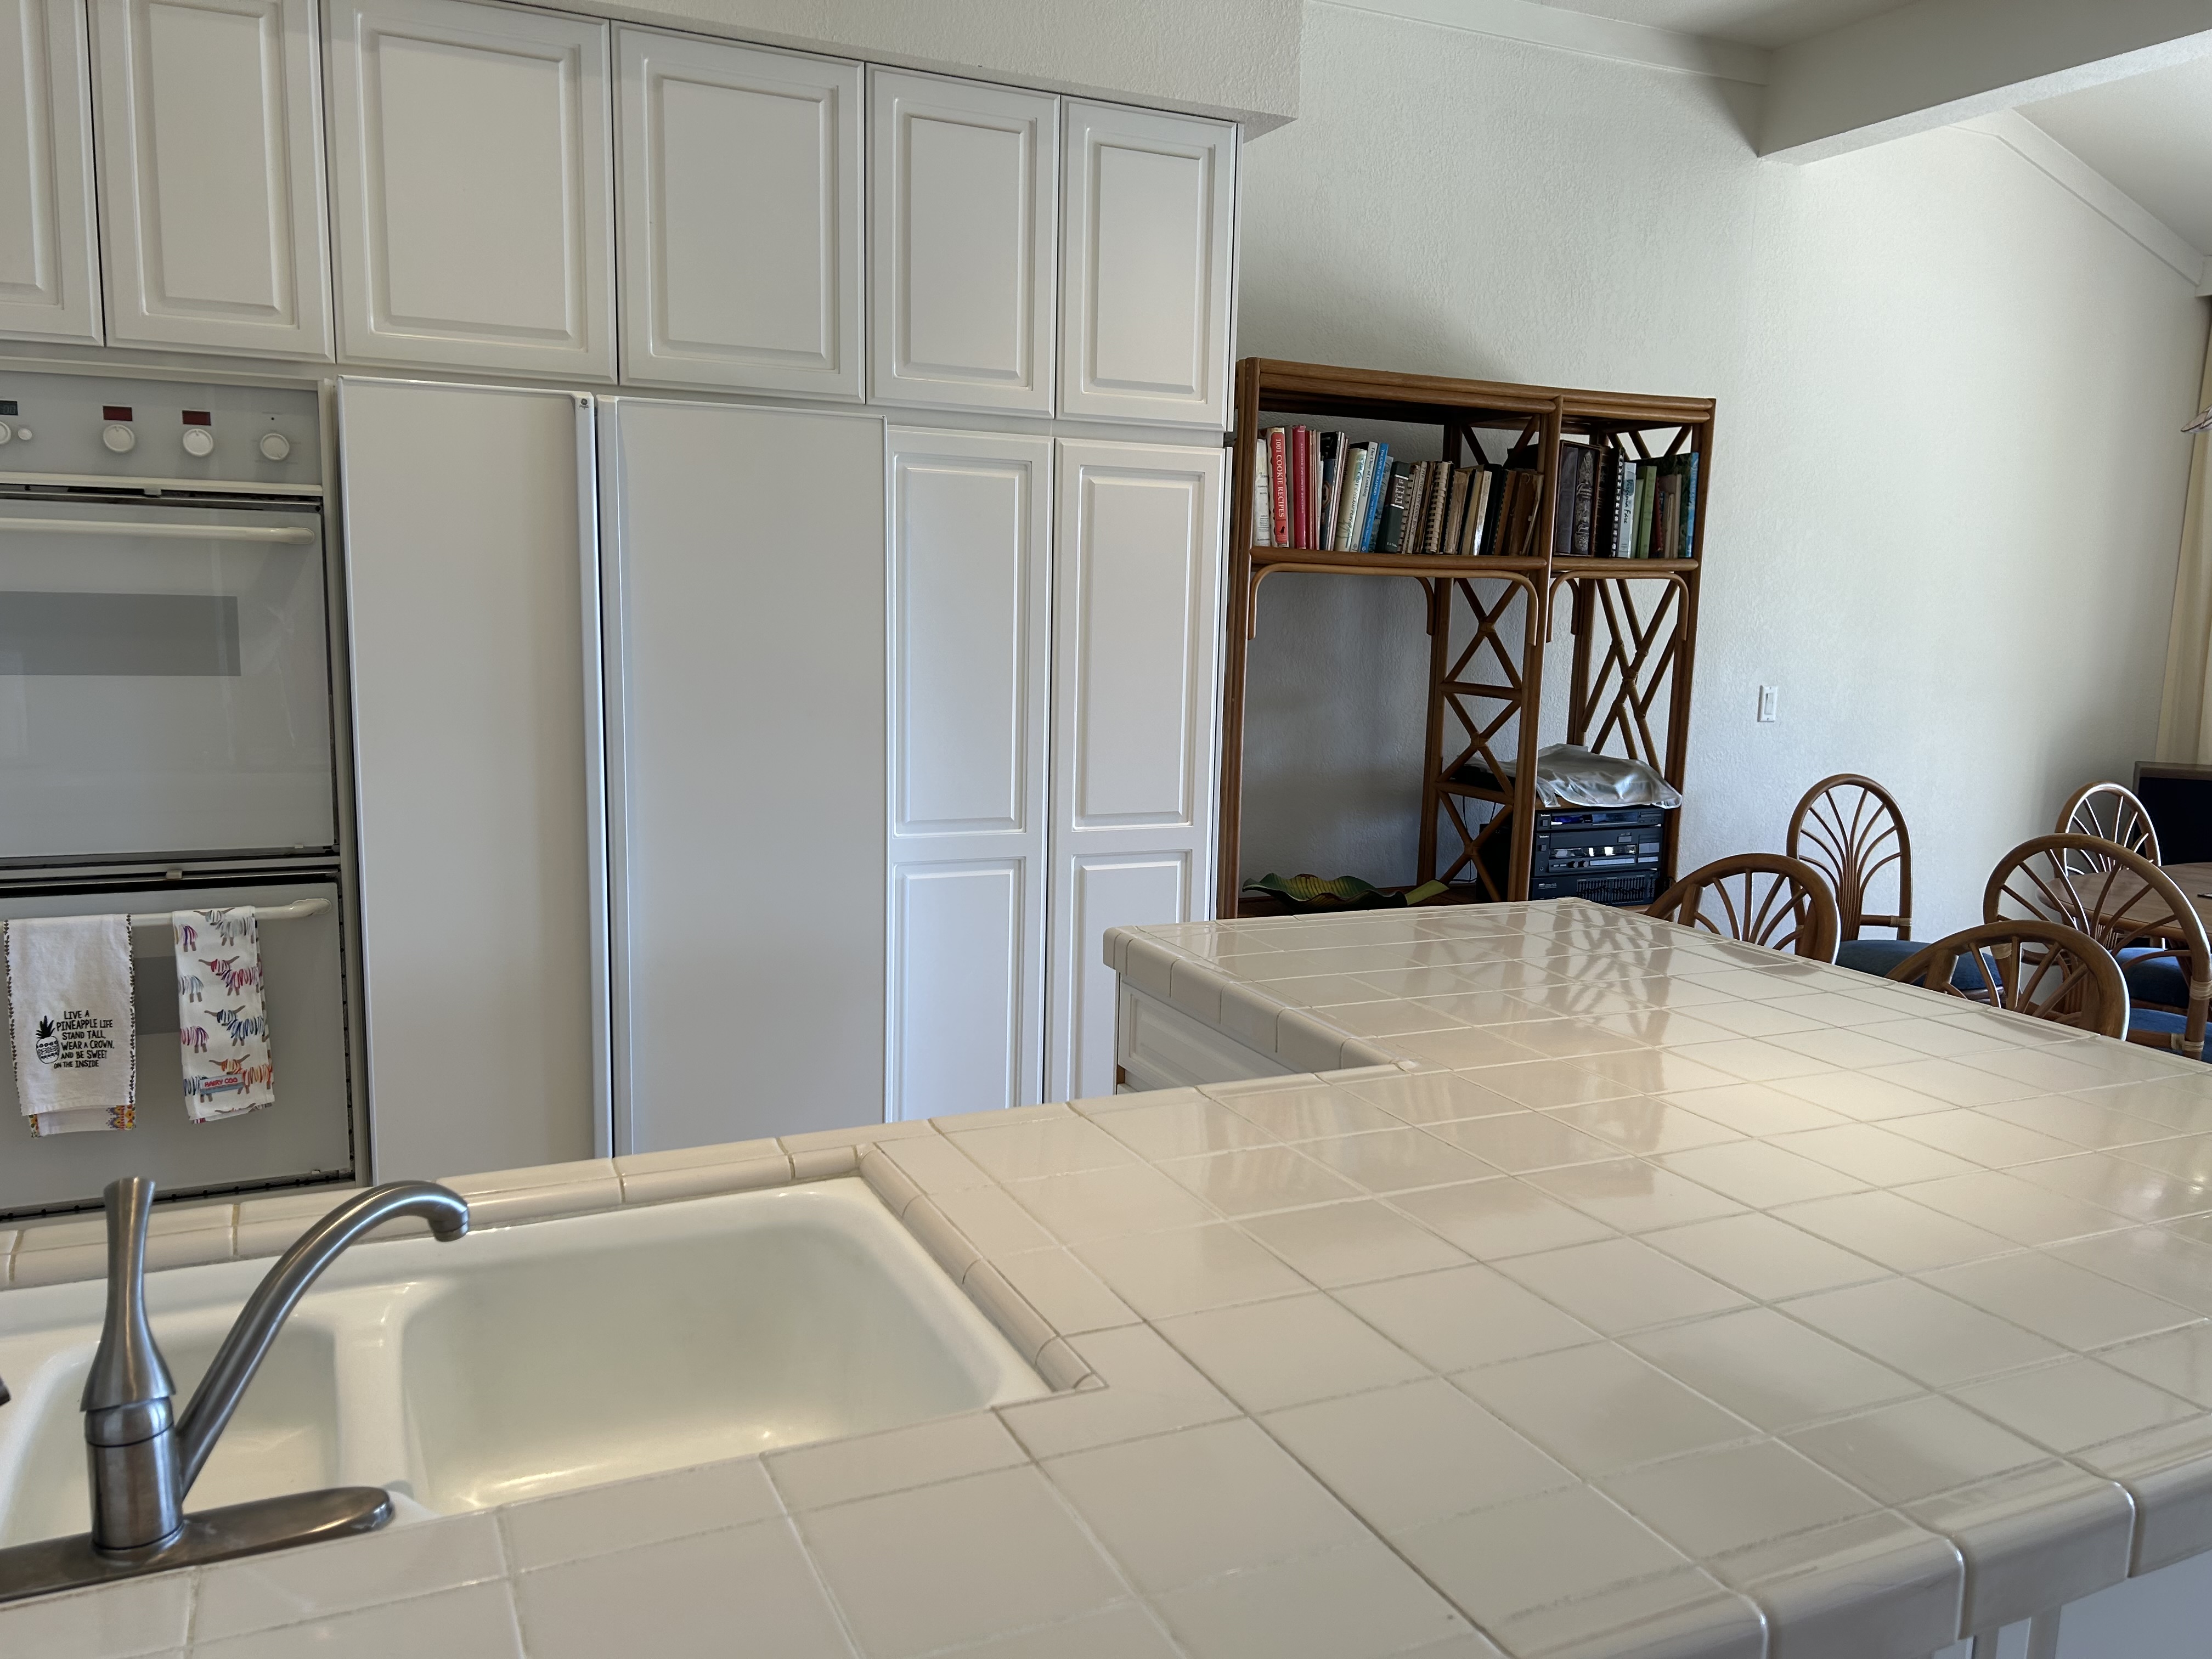
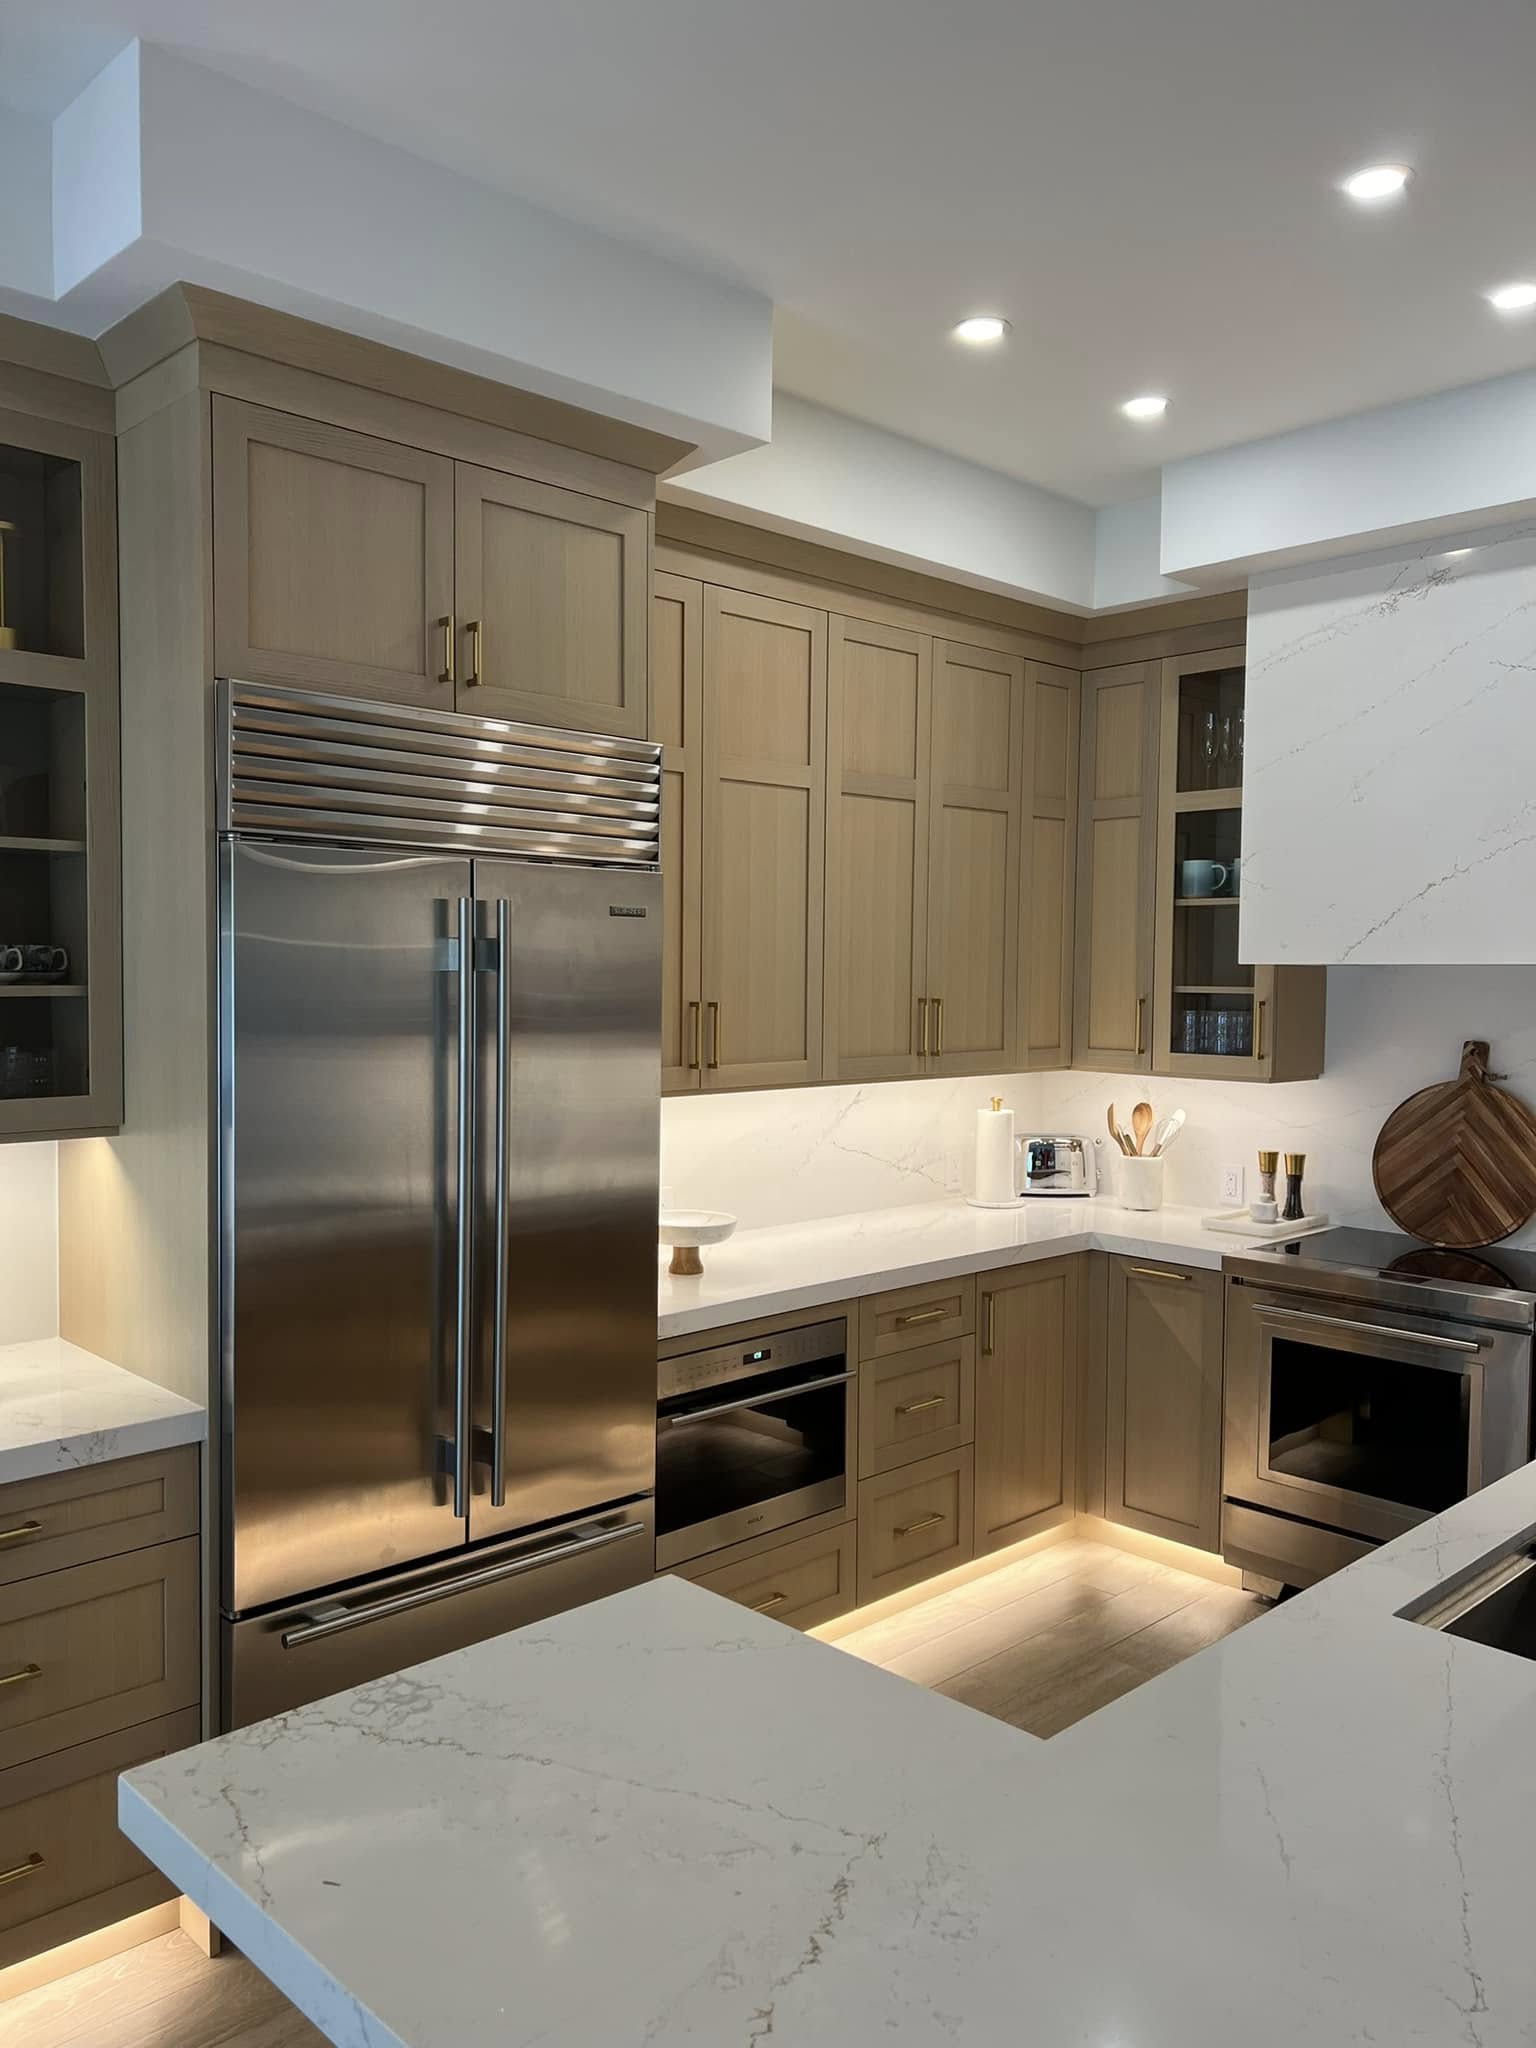
The Bathrooms
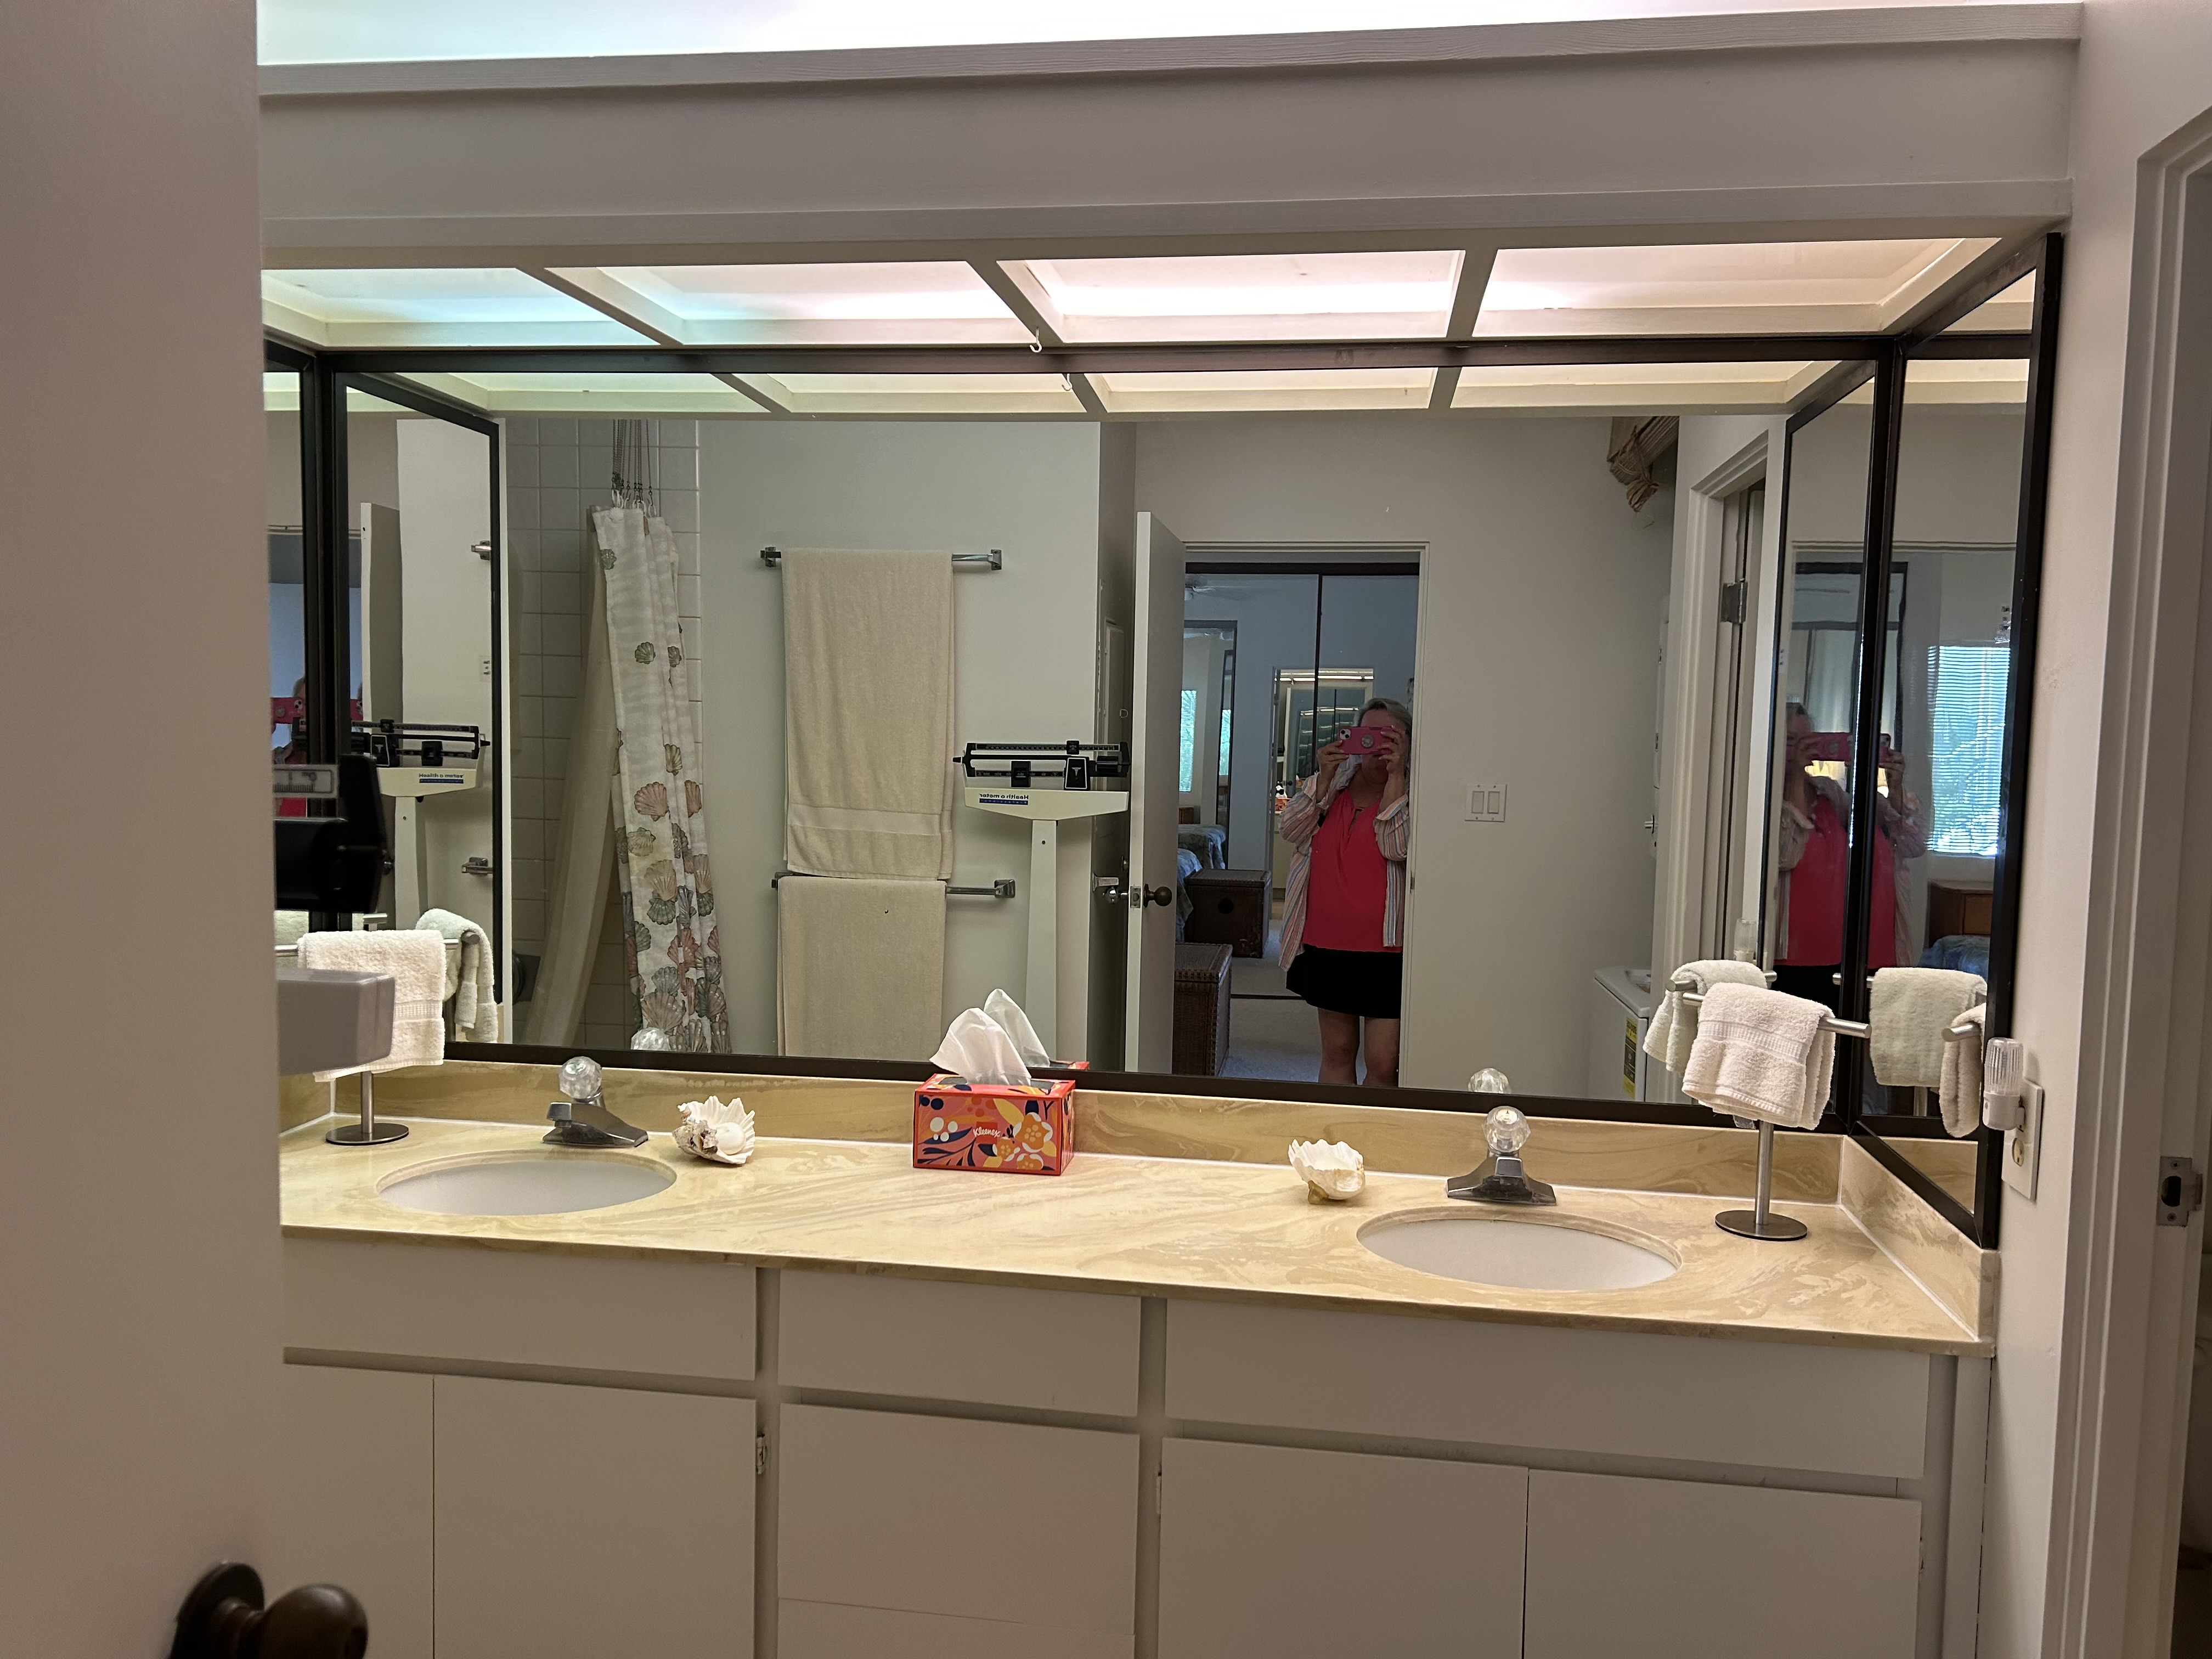
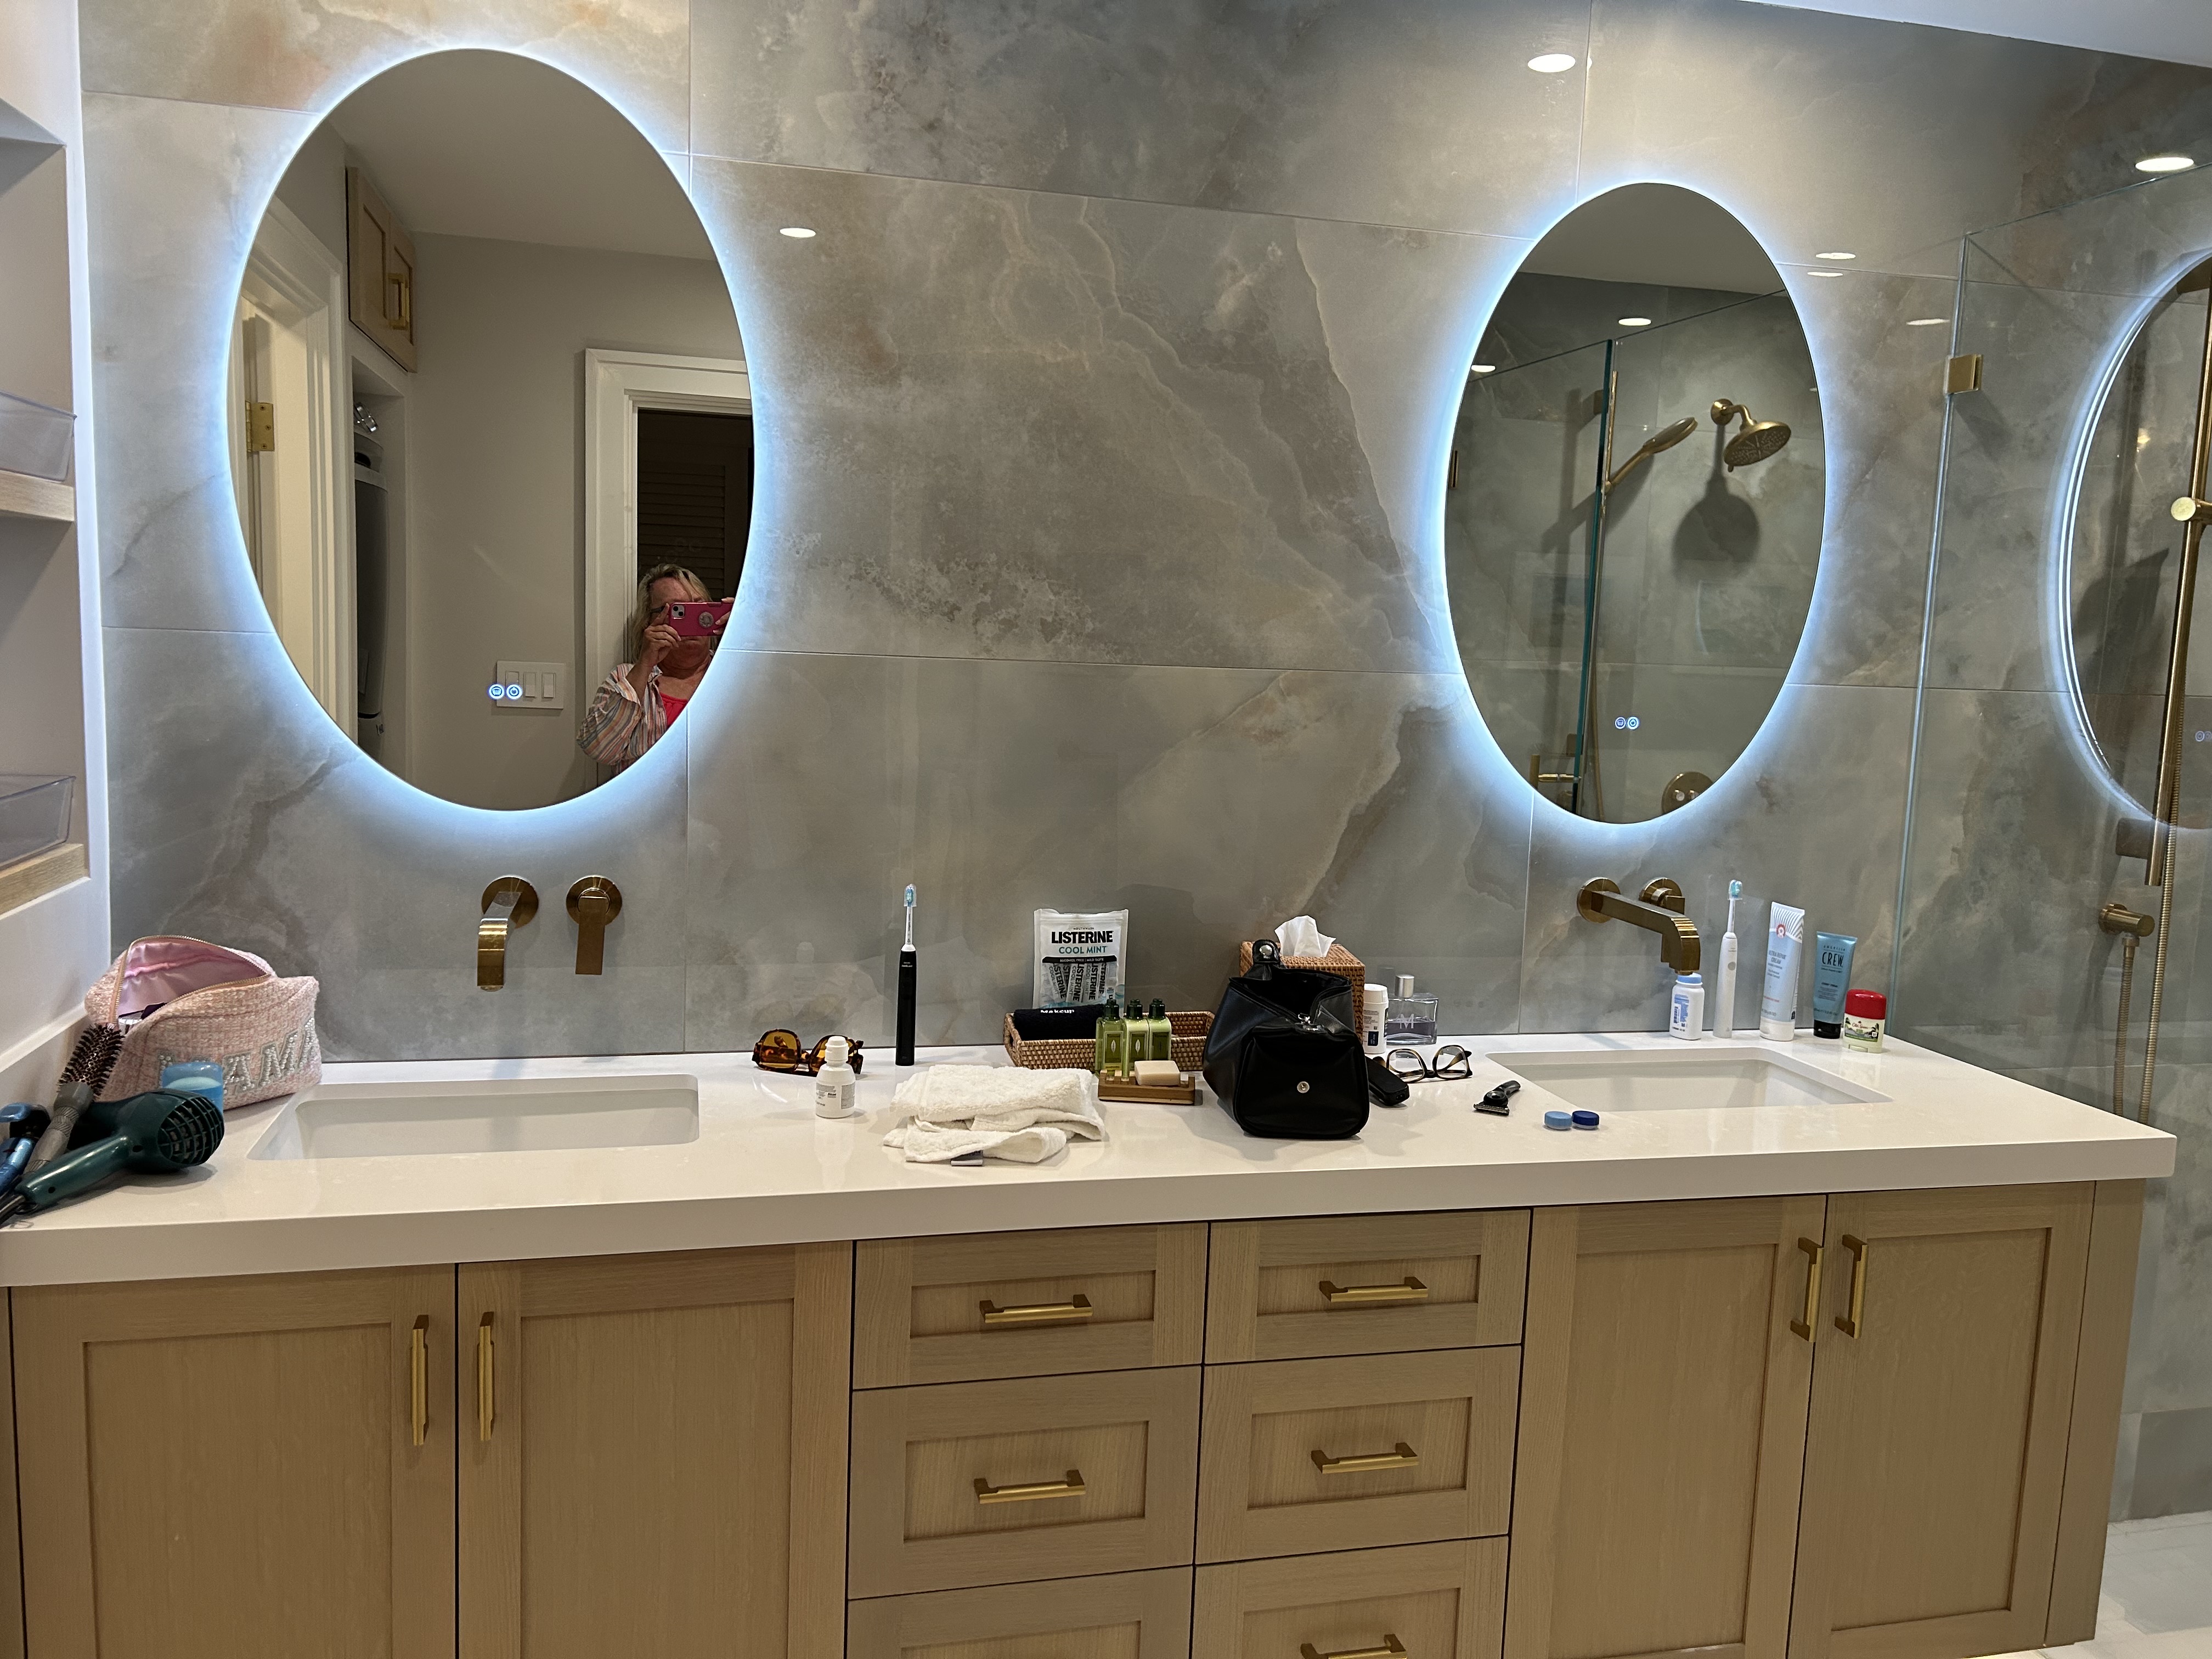
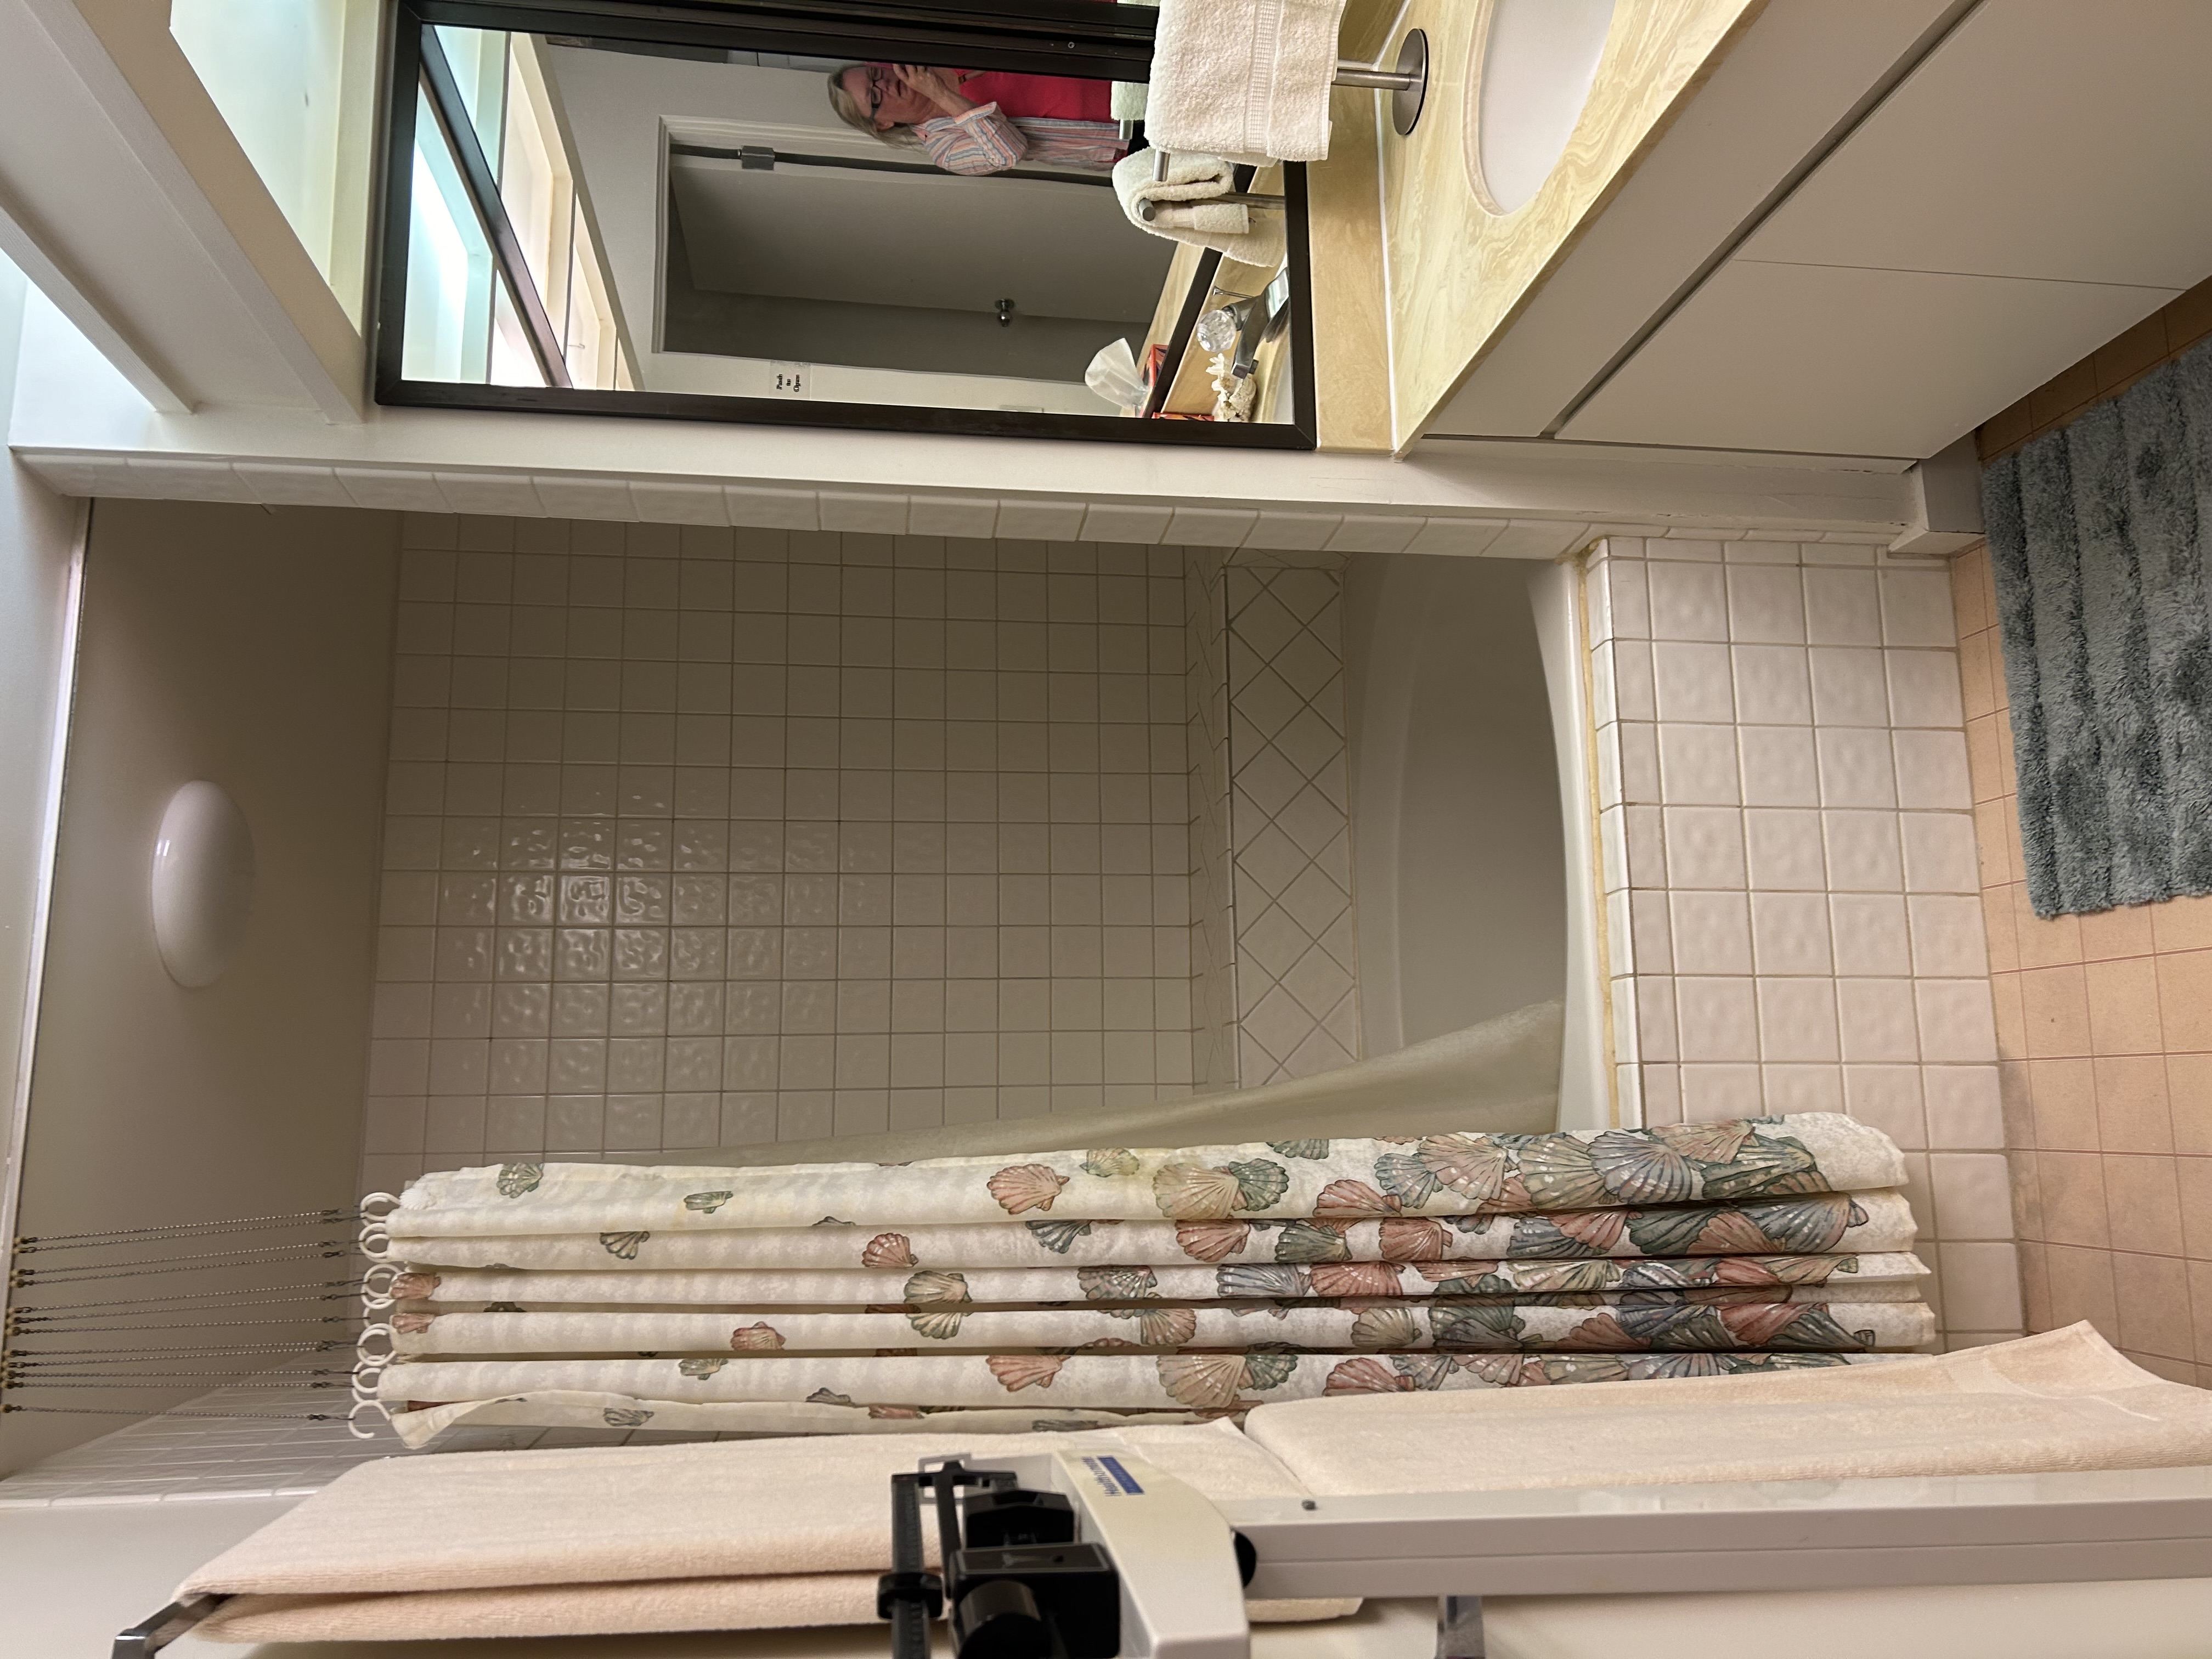
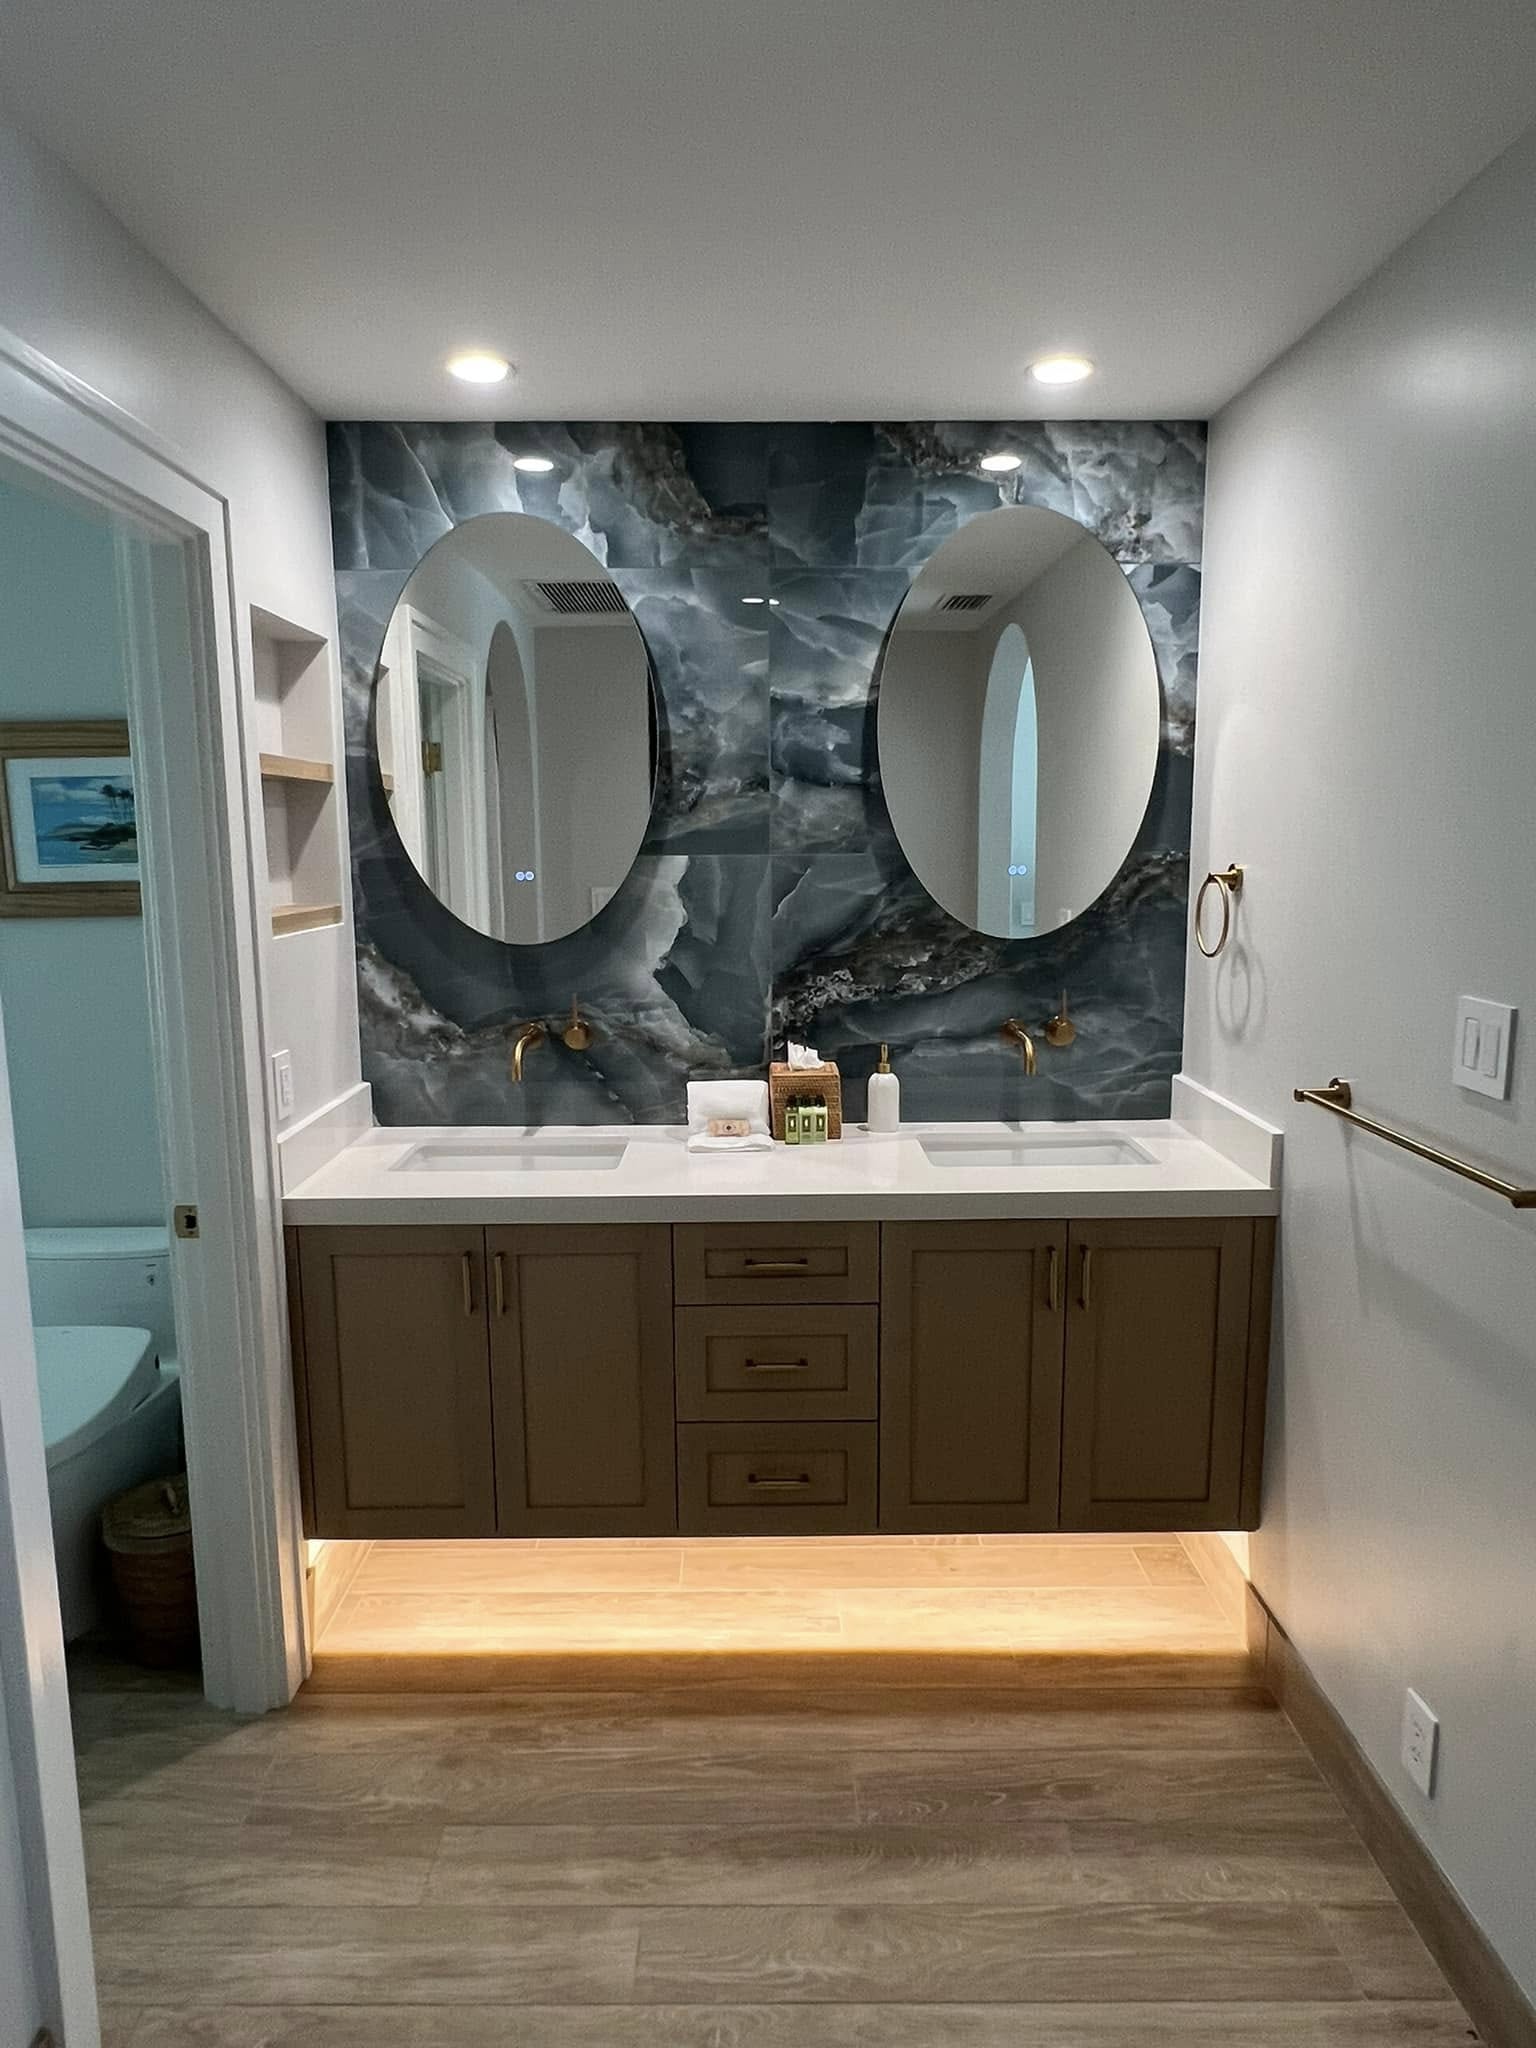
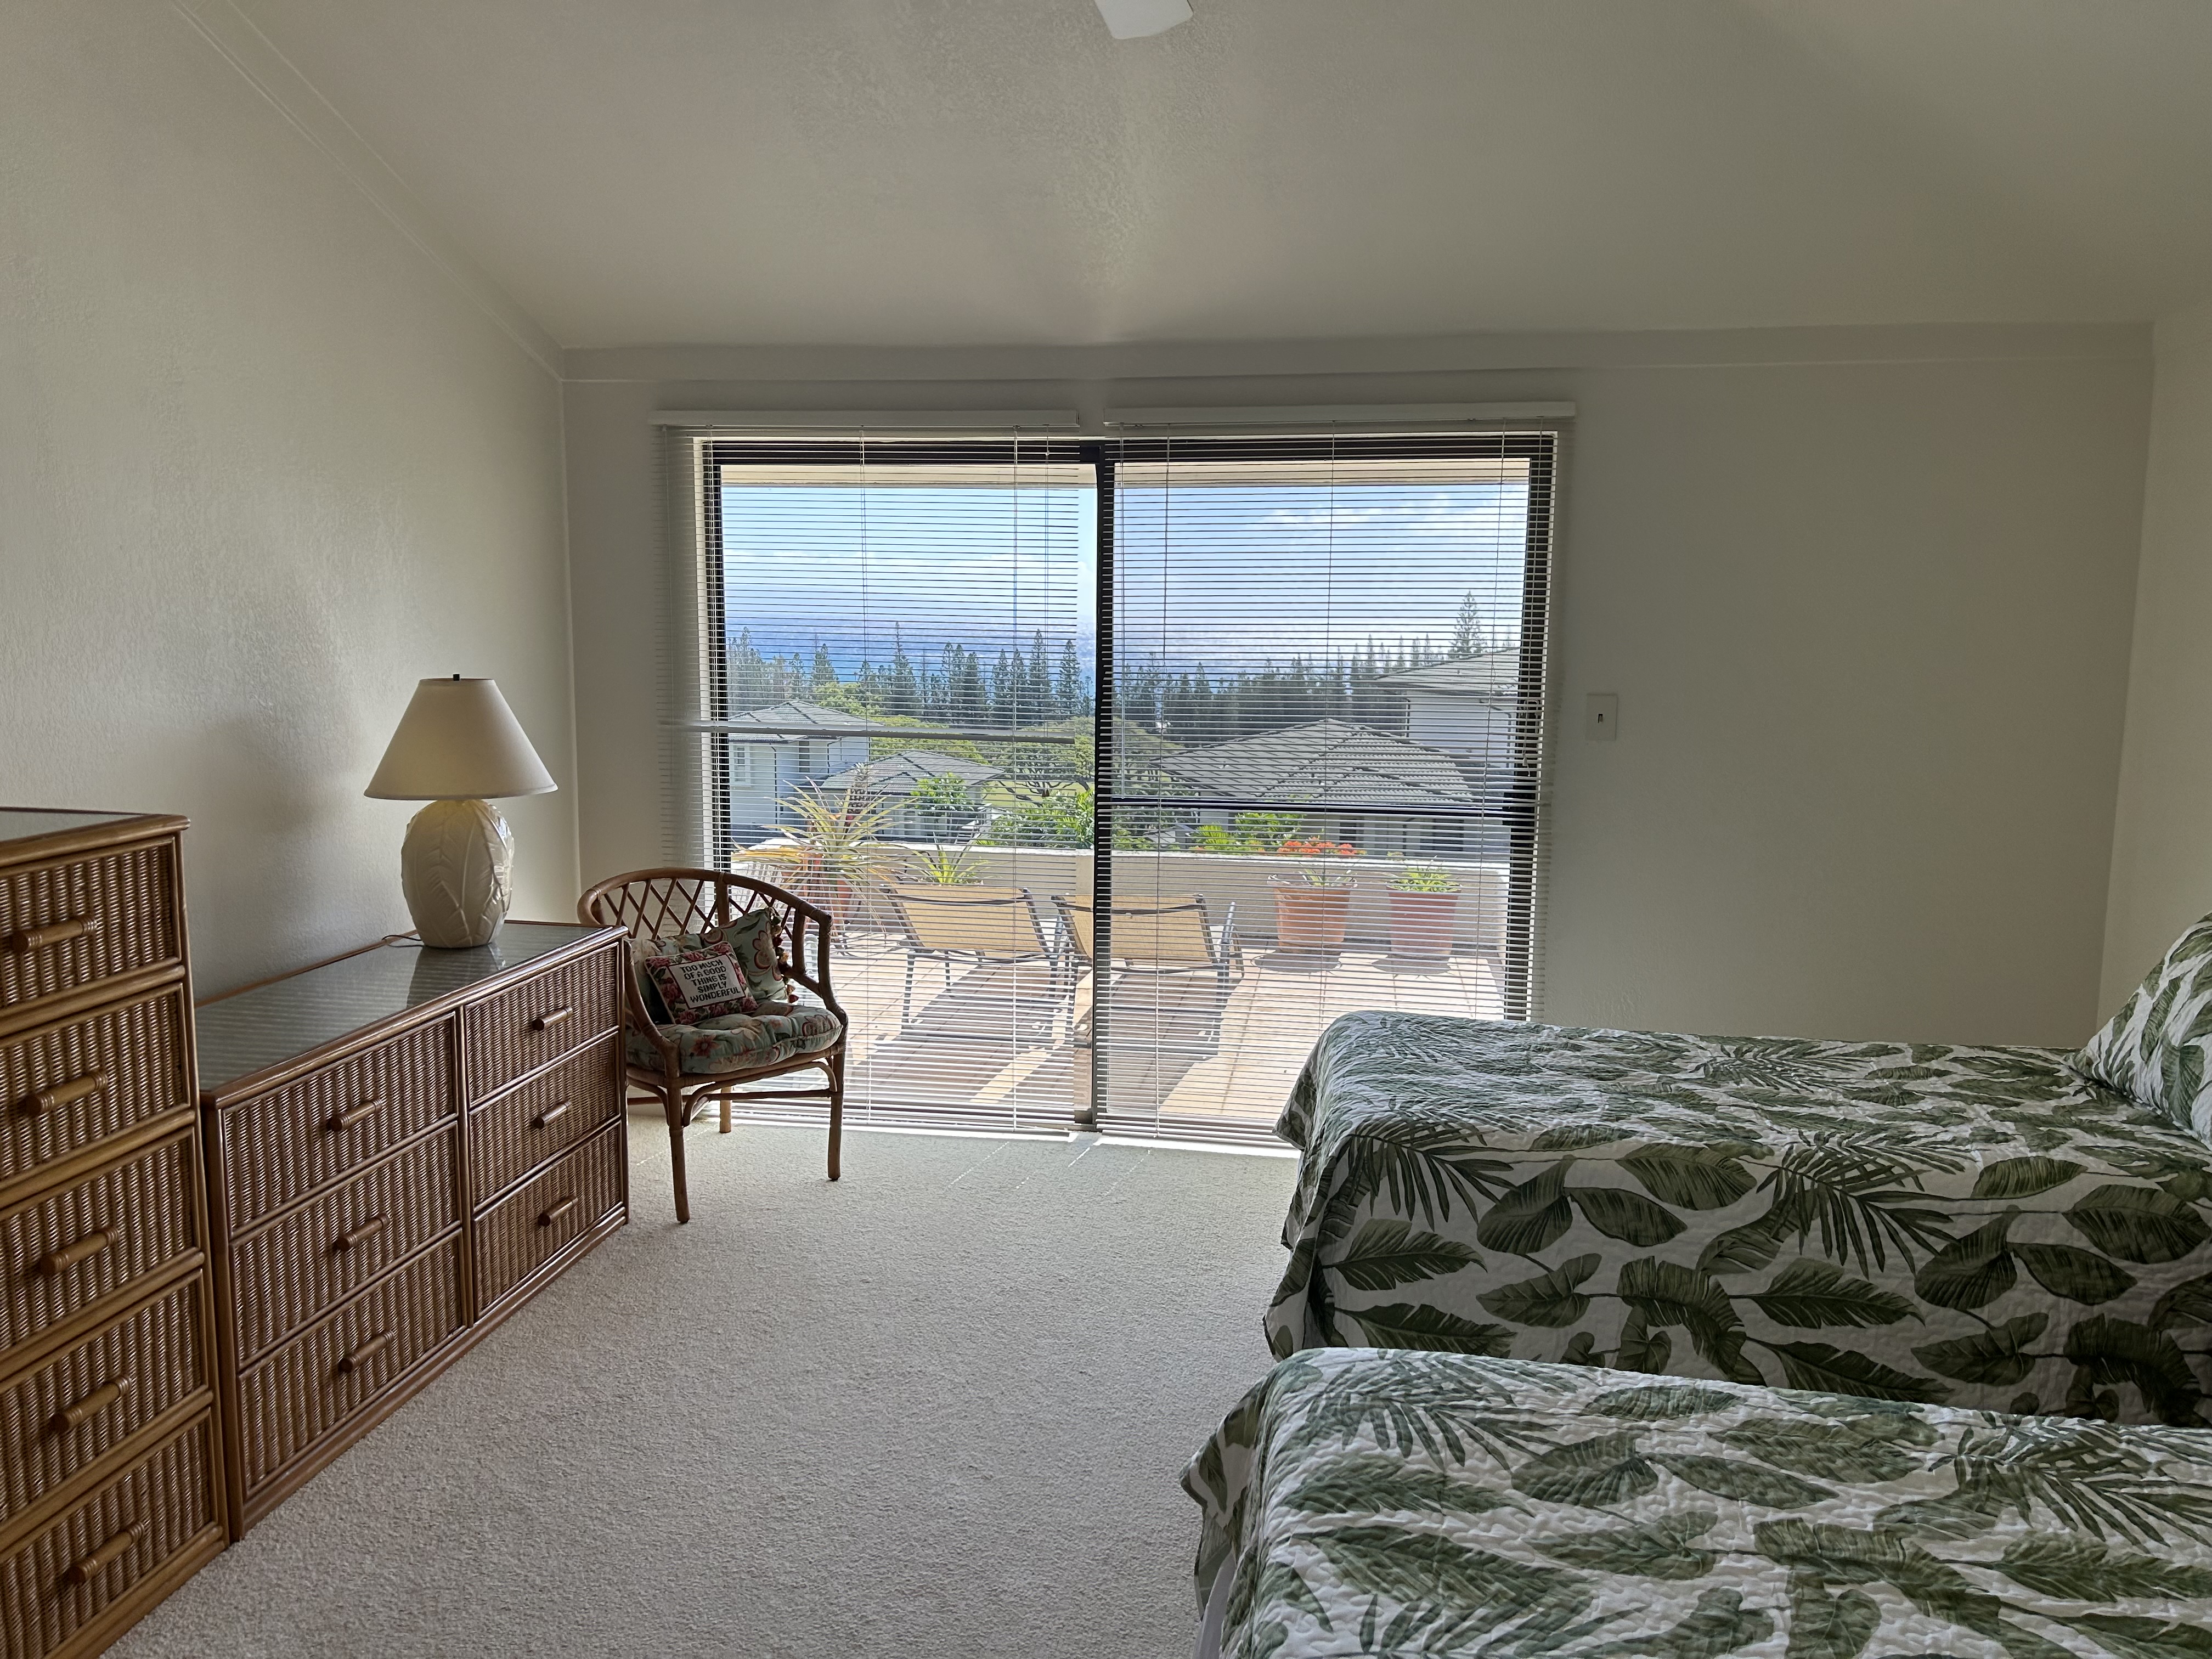 Bedrooms · Before
Hardwood floors, ceiling can lights, and a ceiling fan.
Both bedrooms are getting hardwood in place of the existing carpet, plus 4 new ceiling can lights and a ceiling fan in each. That’s the entire bedroom scope. No layout changes, no walls moved. The renovation budget concentrates where it has the biggest impact: the kitchen, the living spaces, and the baths.
New floor-to-ceiling cabinetry, hallway to secondary bath.
One of the highest-leverage adds in the renovation. Custom floor-to-ceiling cabinetry in the hall leading to the secondary bath, finished in light oak with brass pulls. Hidden storage that pulls the unit's finish level up to the comp next door.
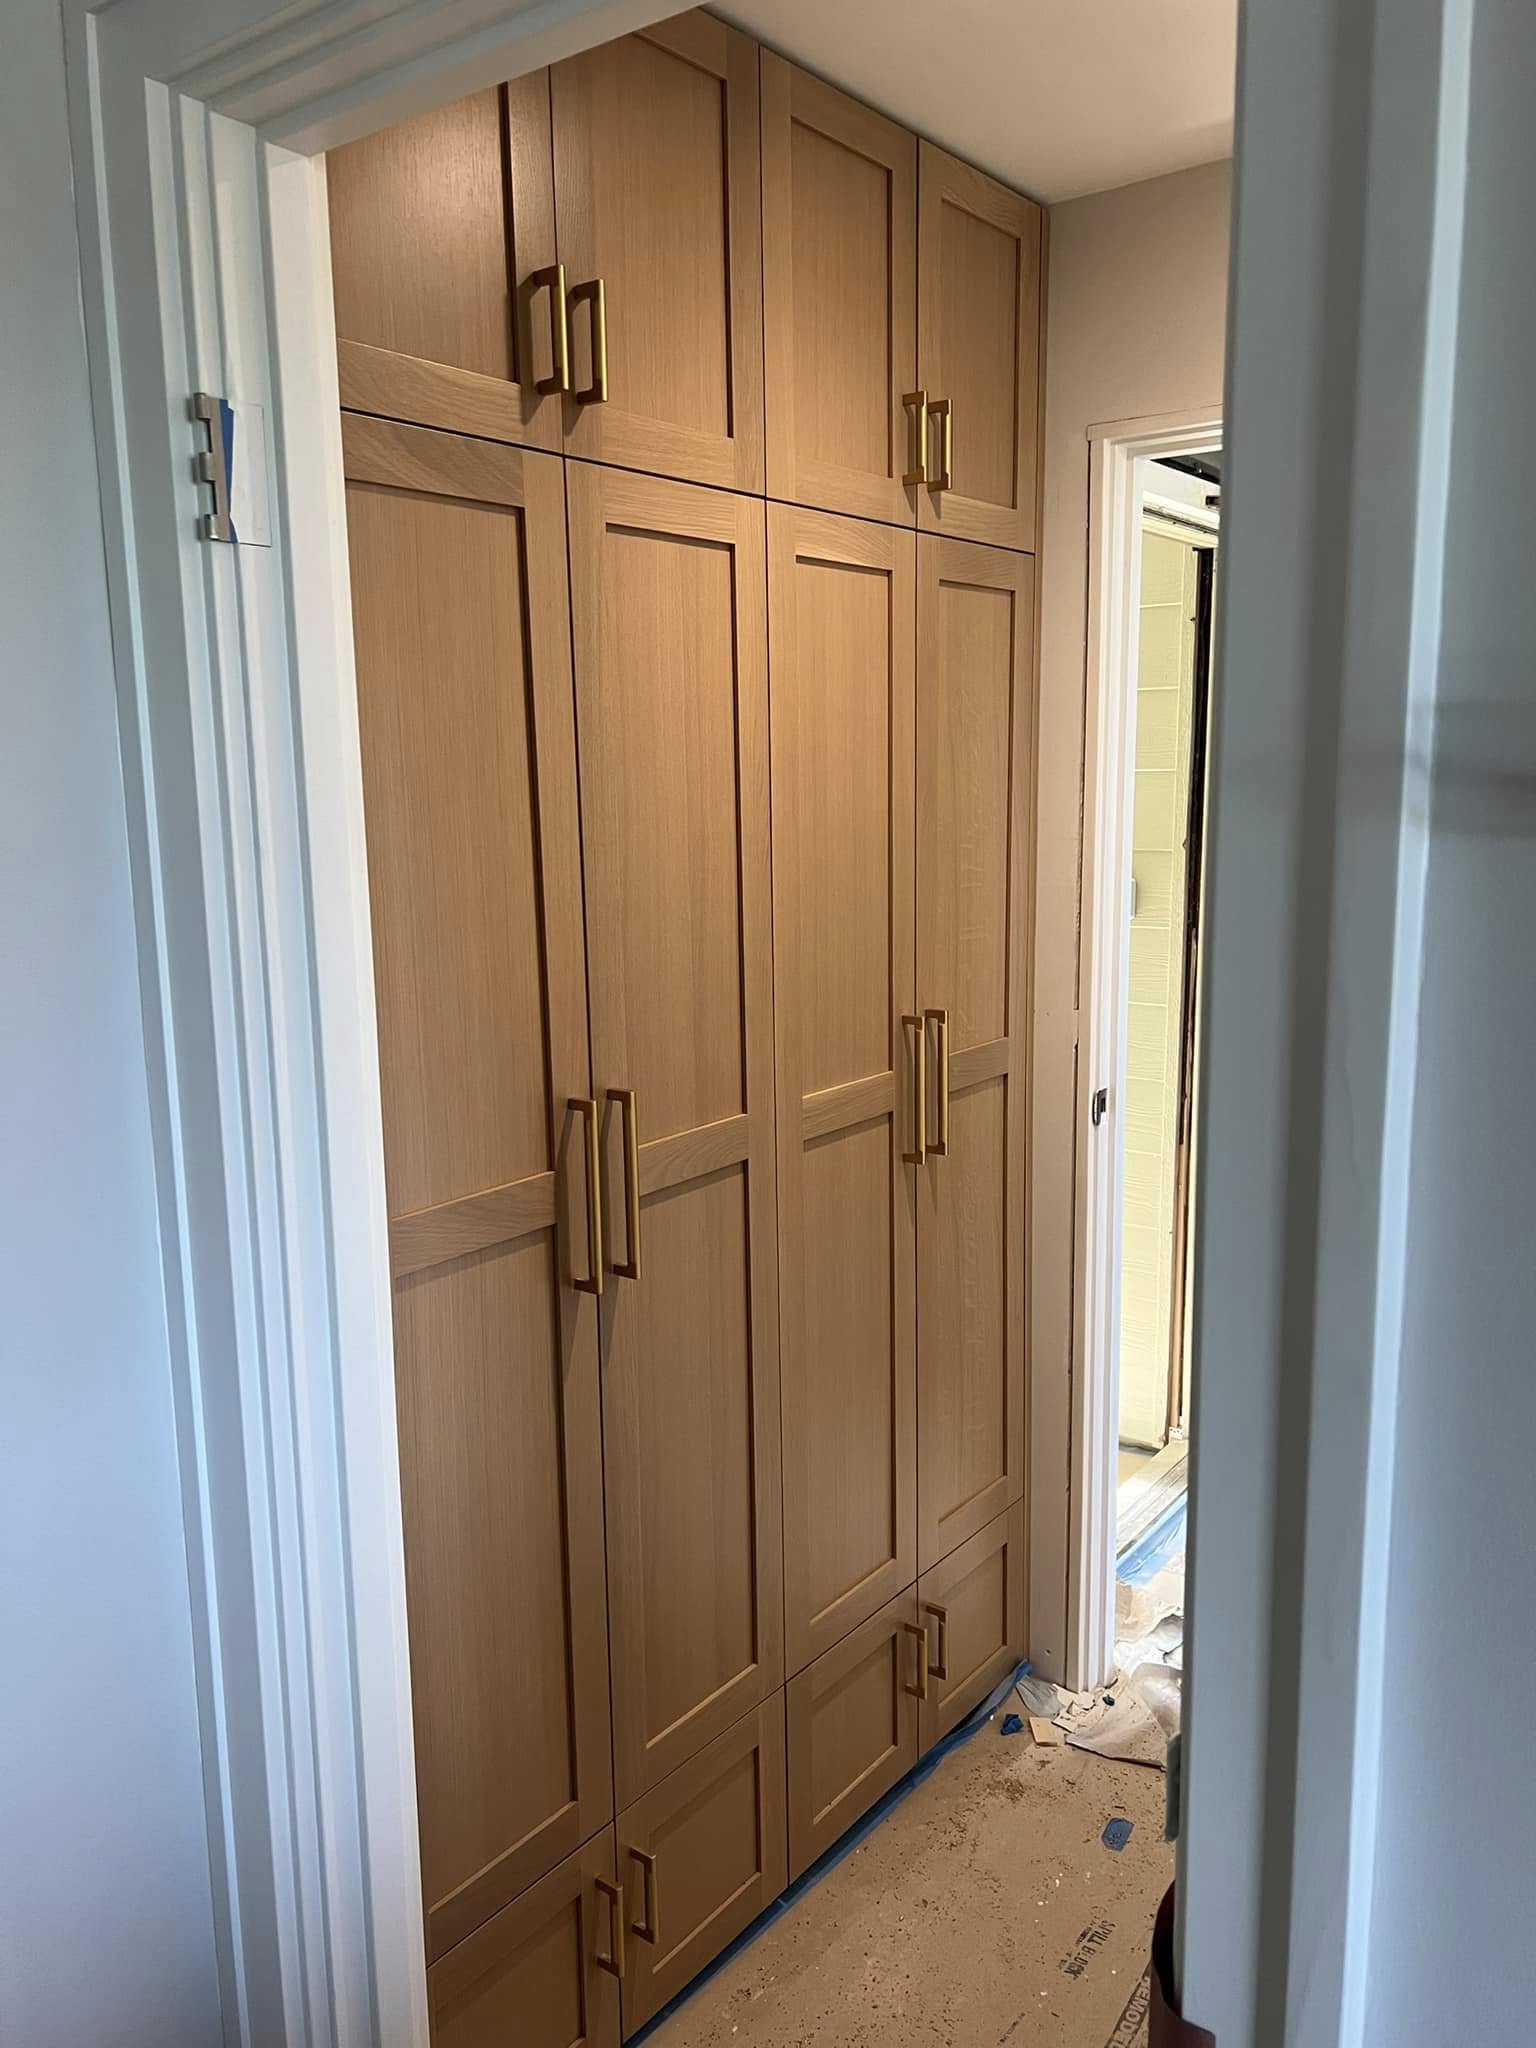 Hallway · After
More of the renovated unit next door.
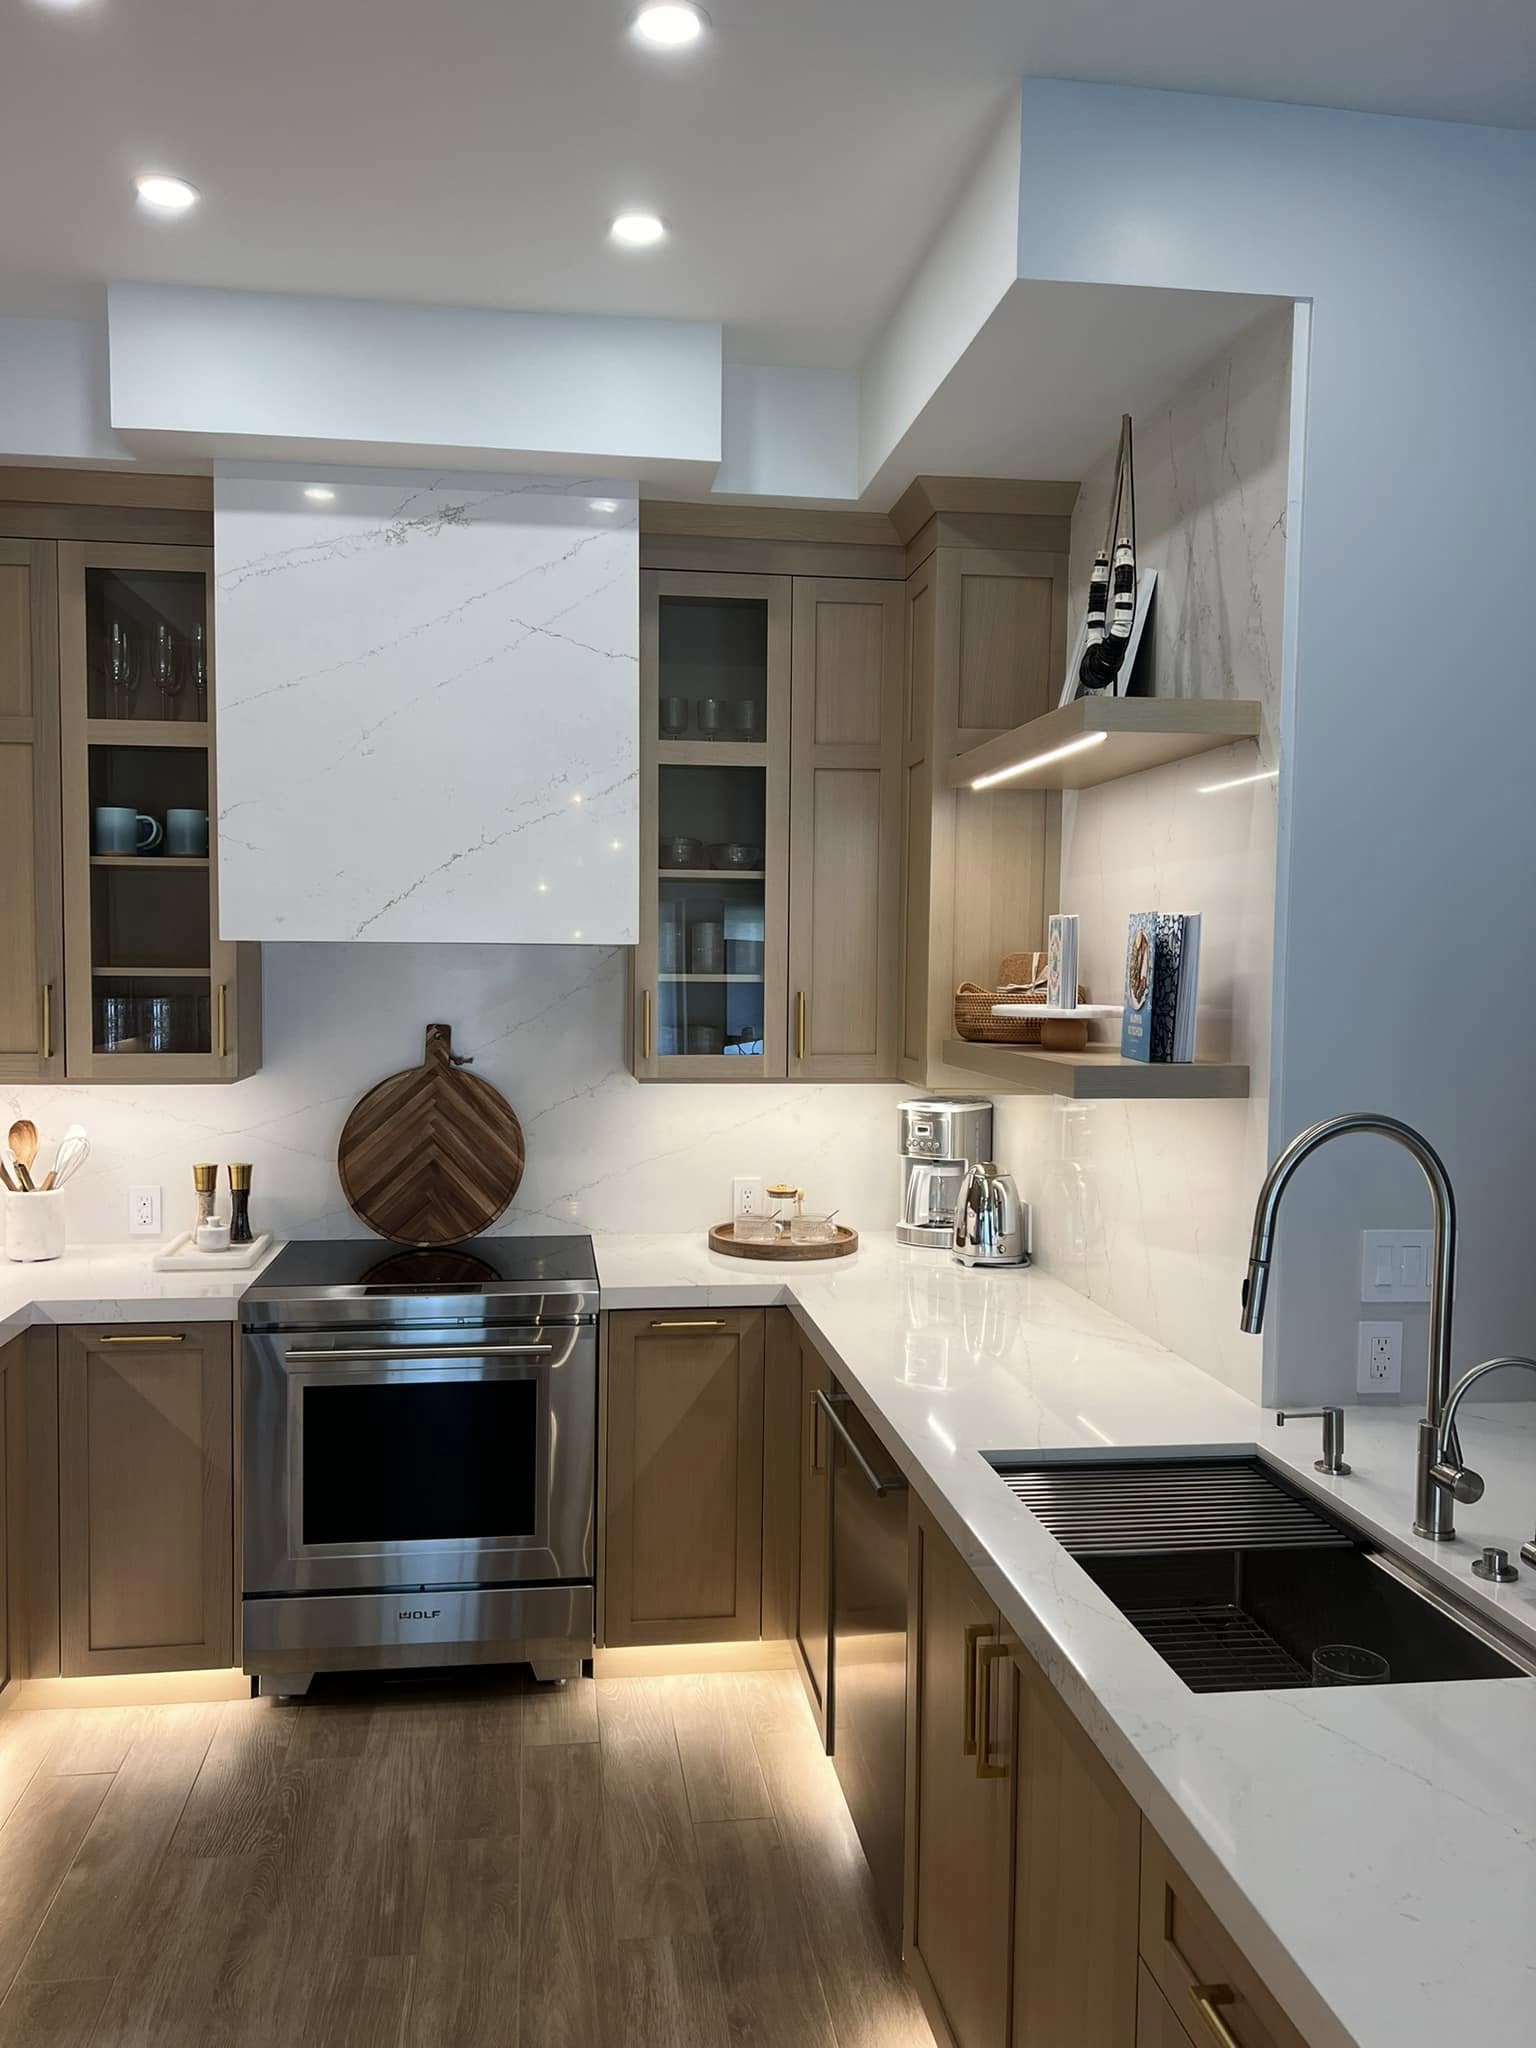
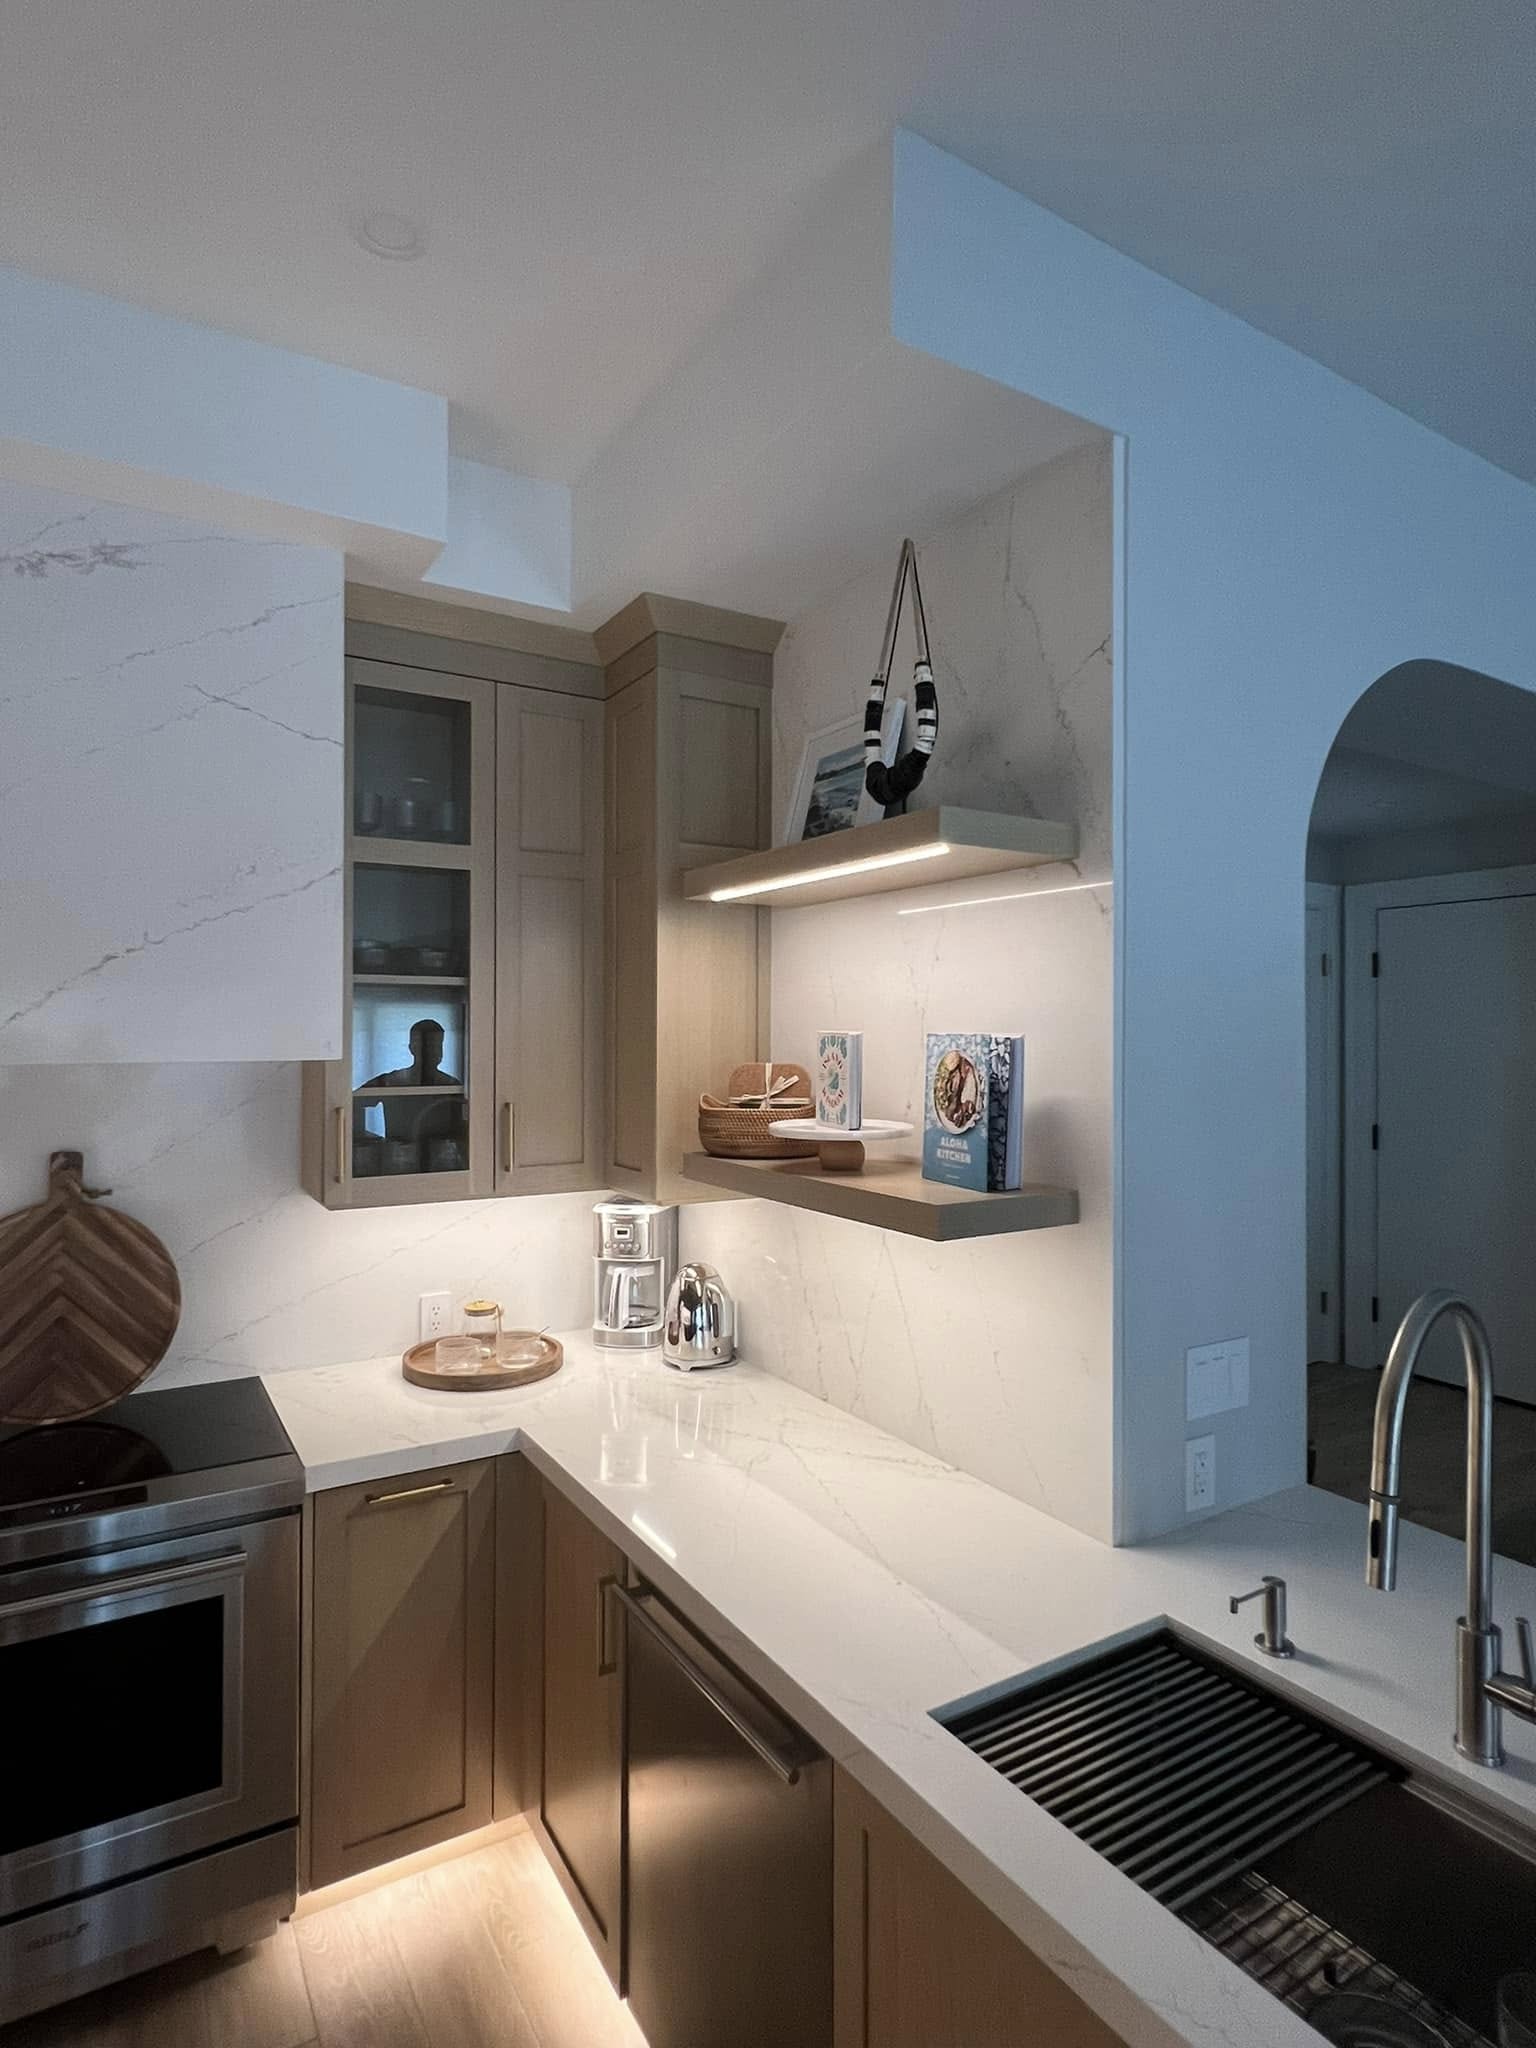
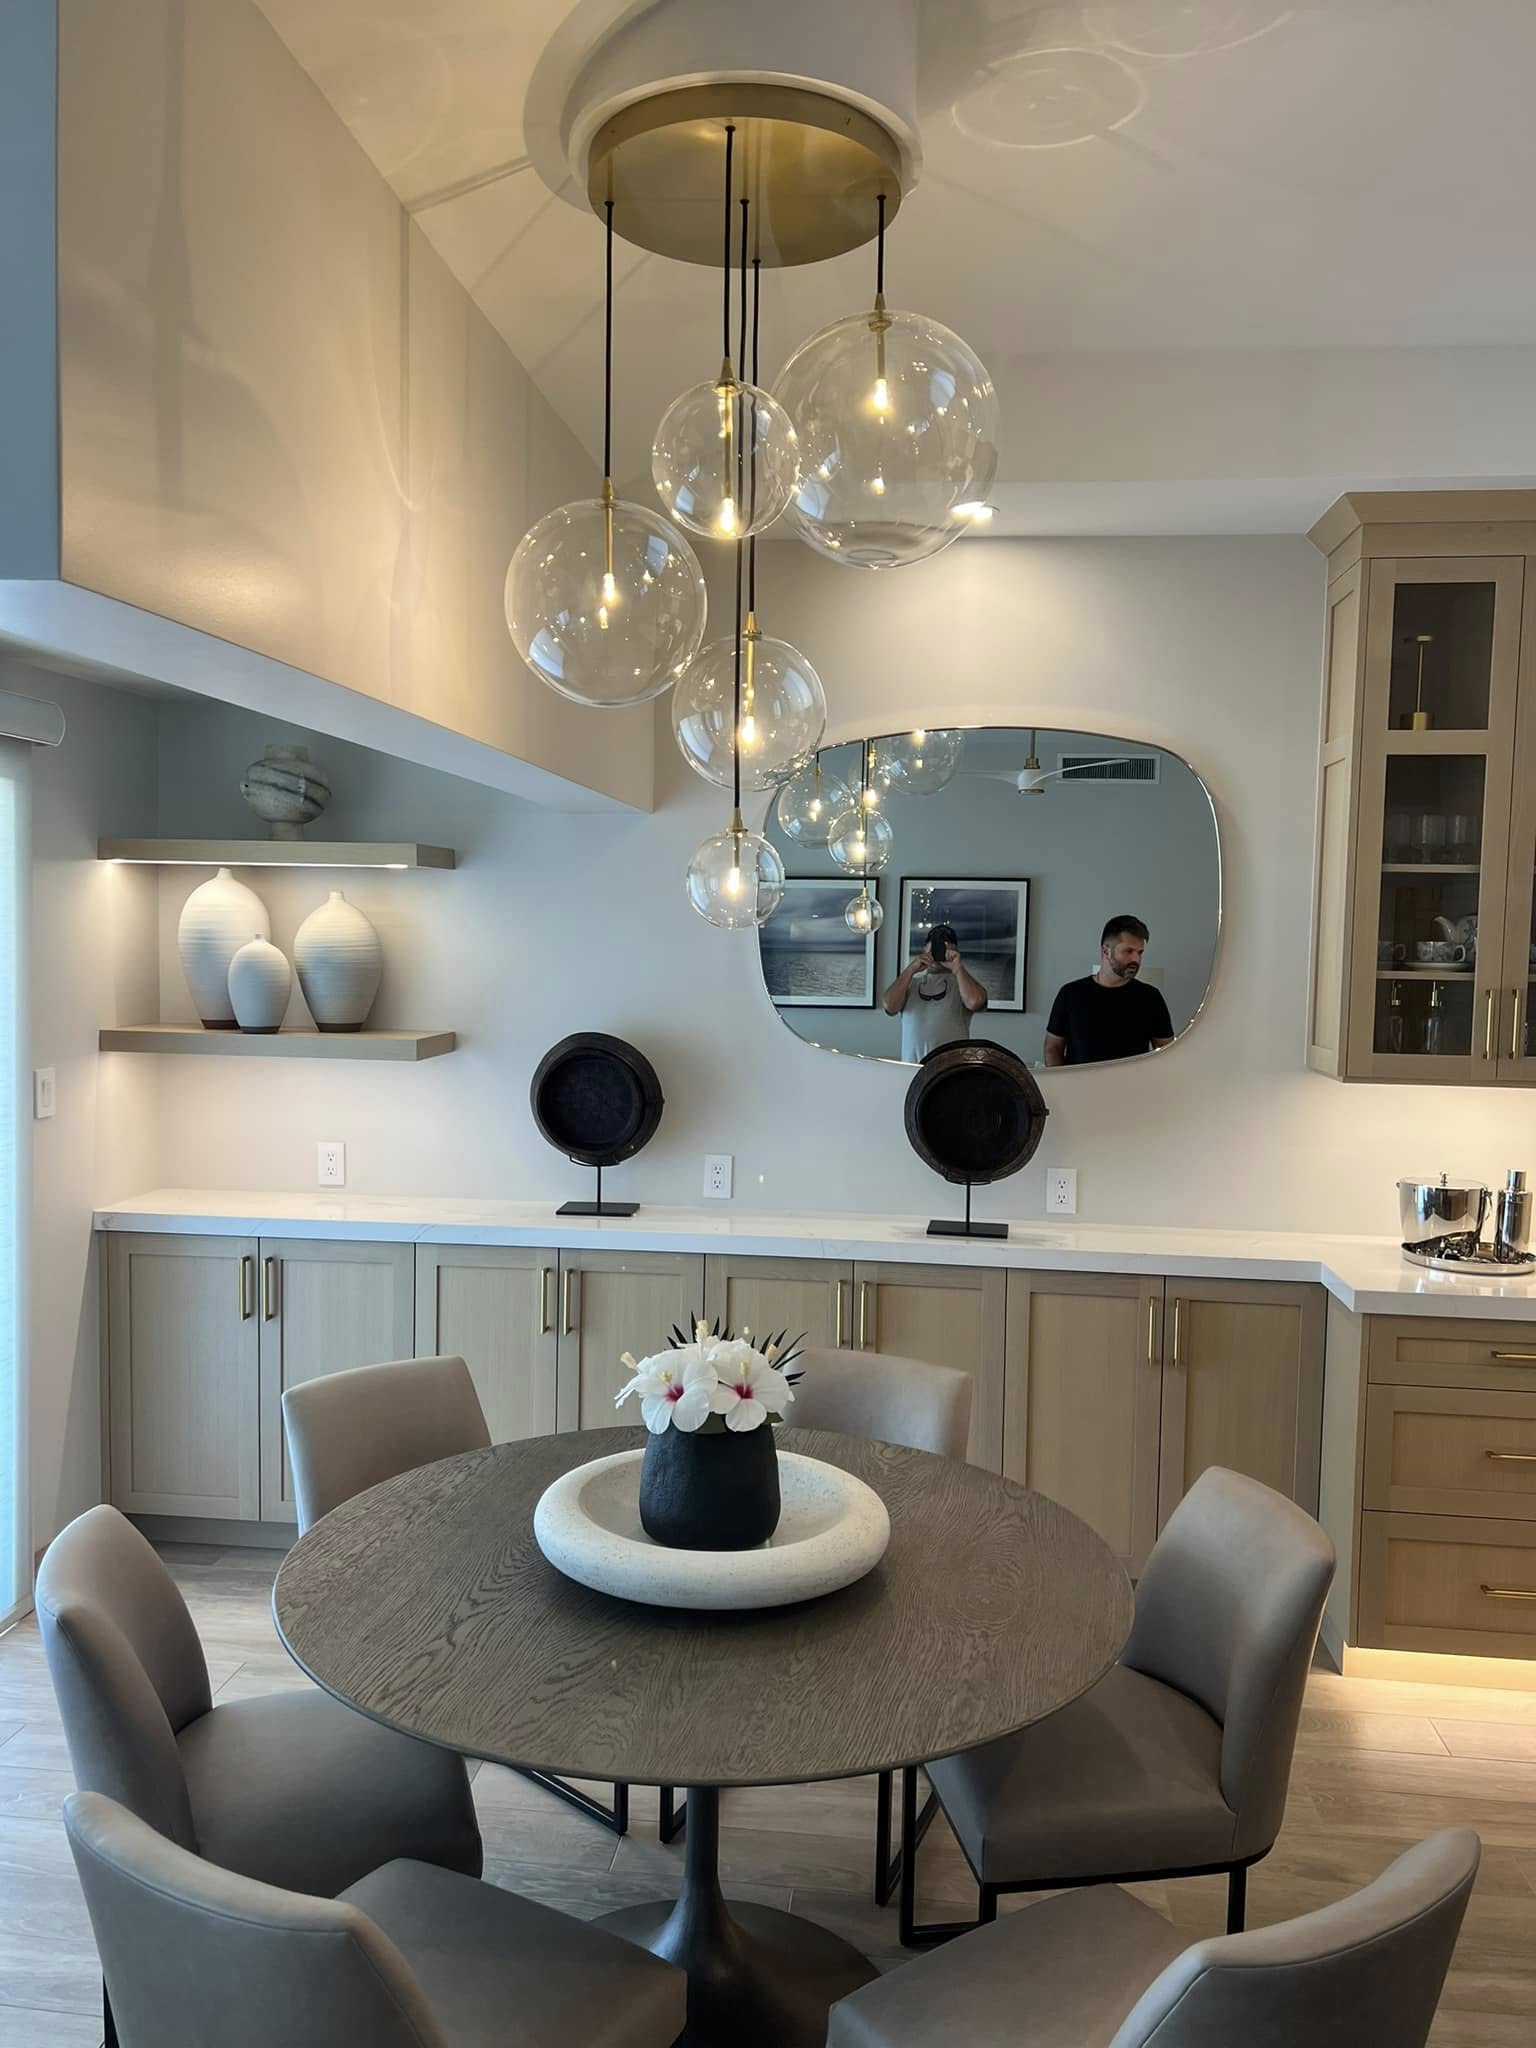
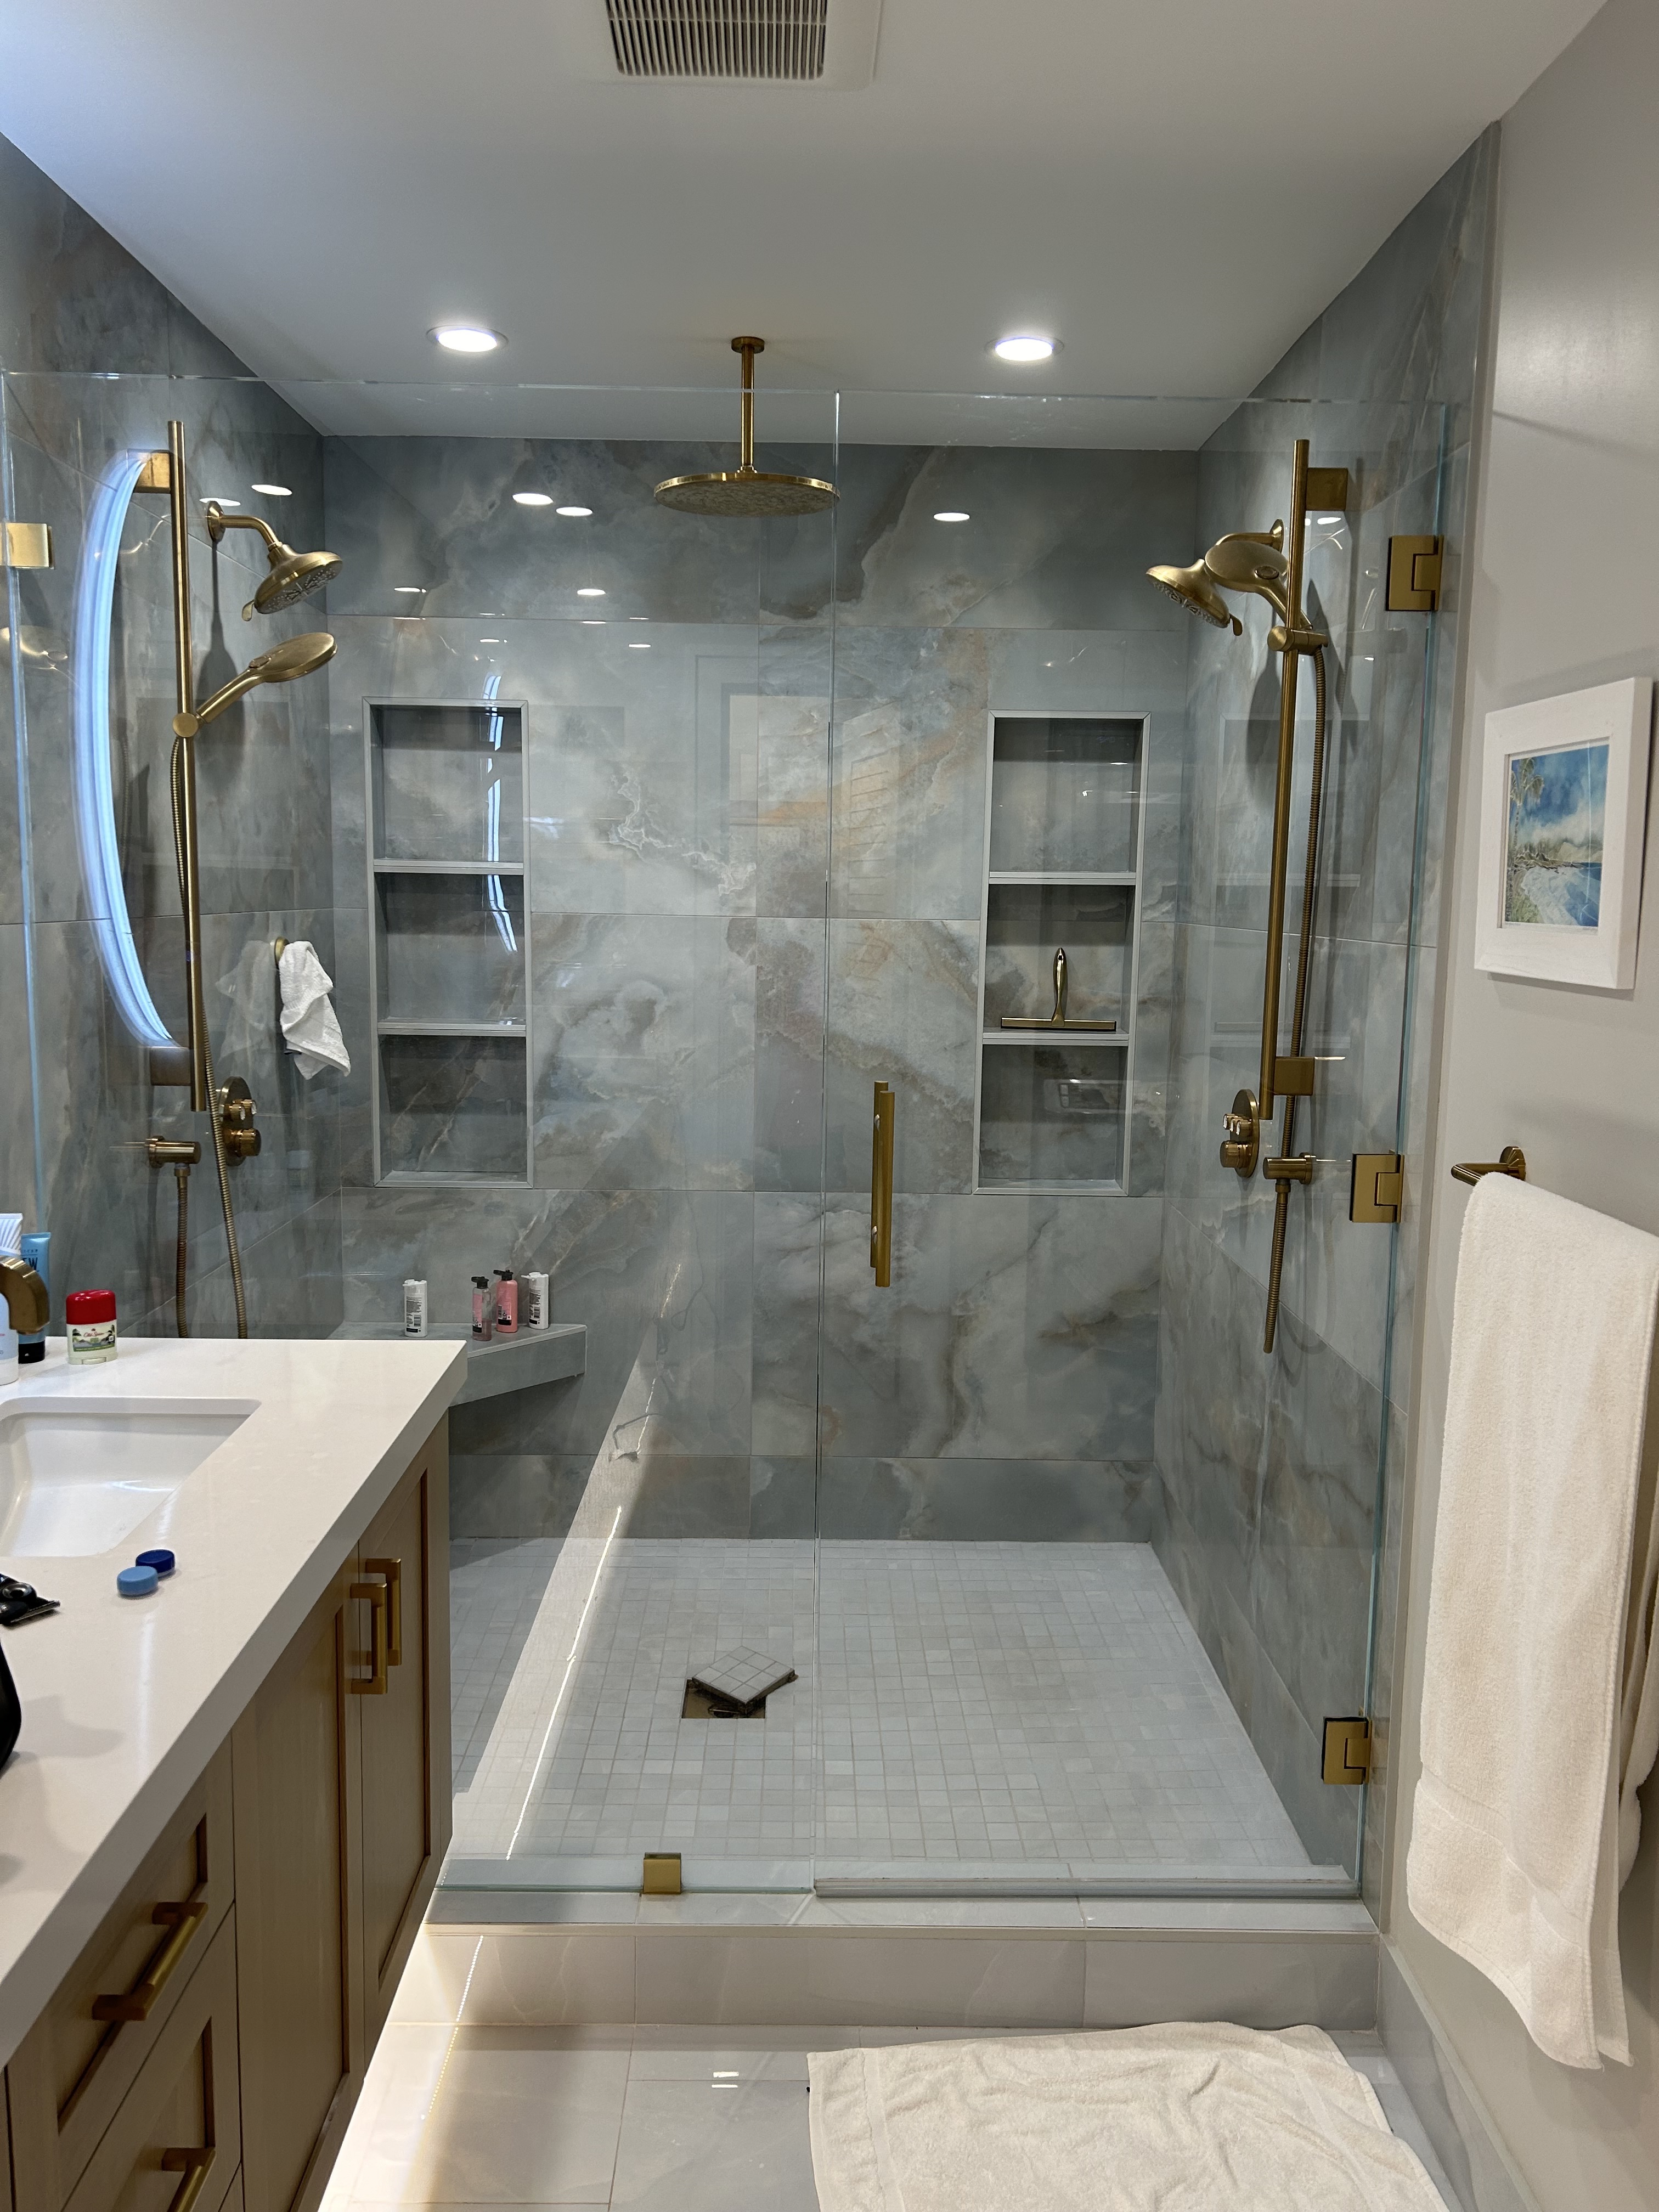
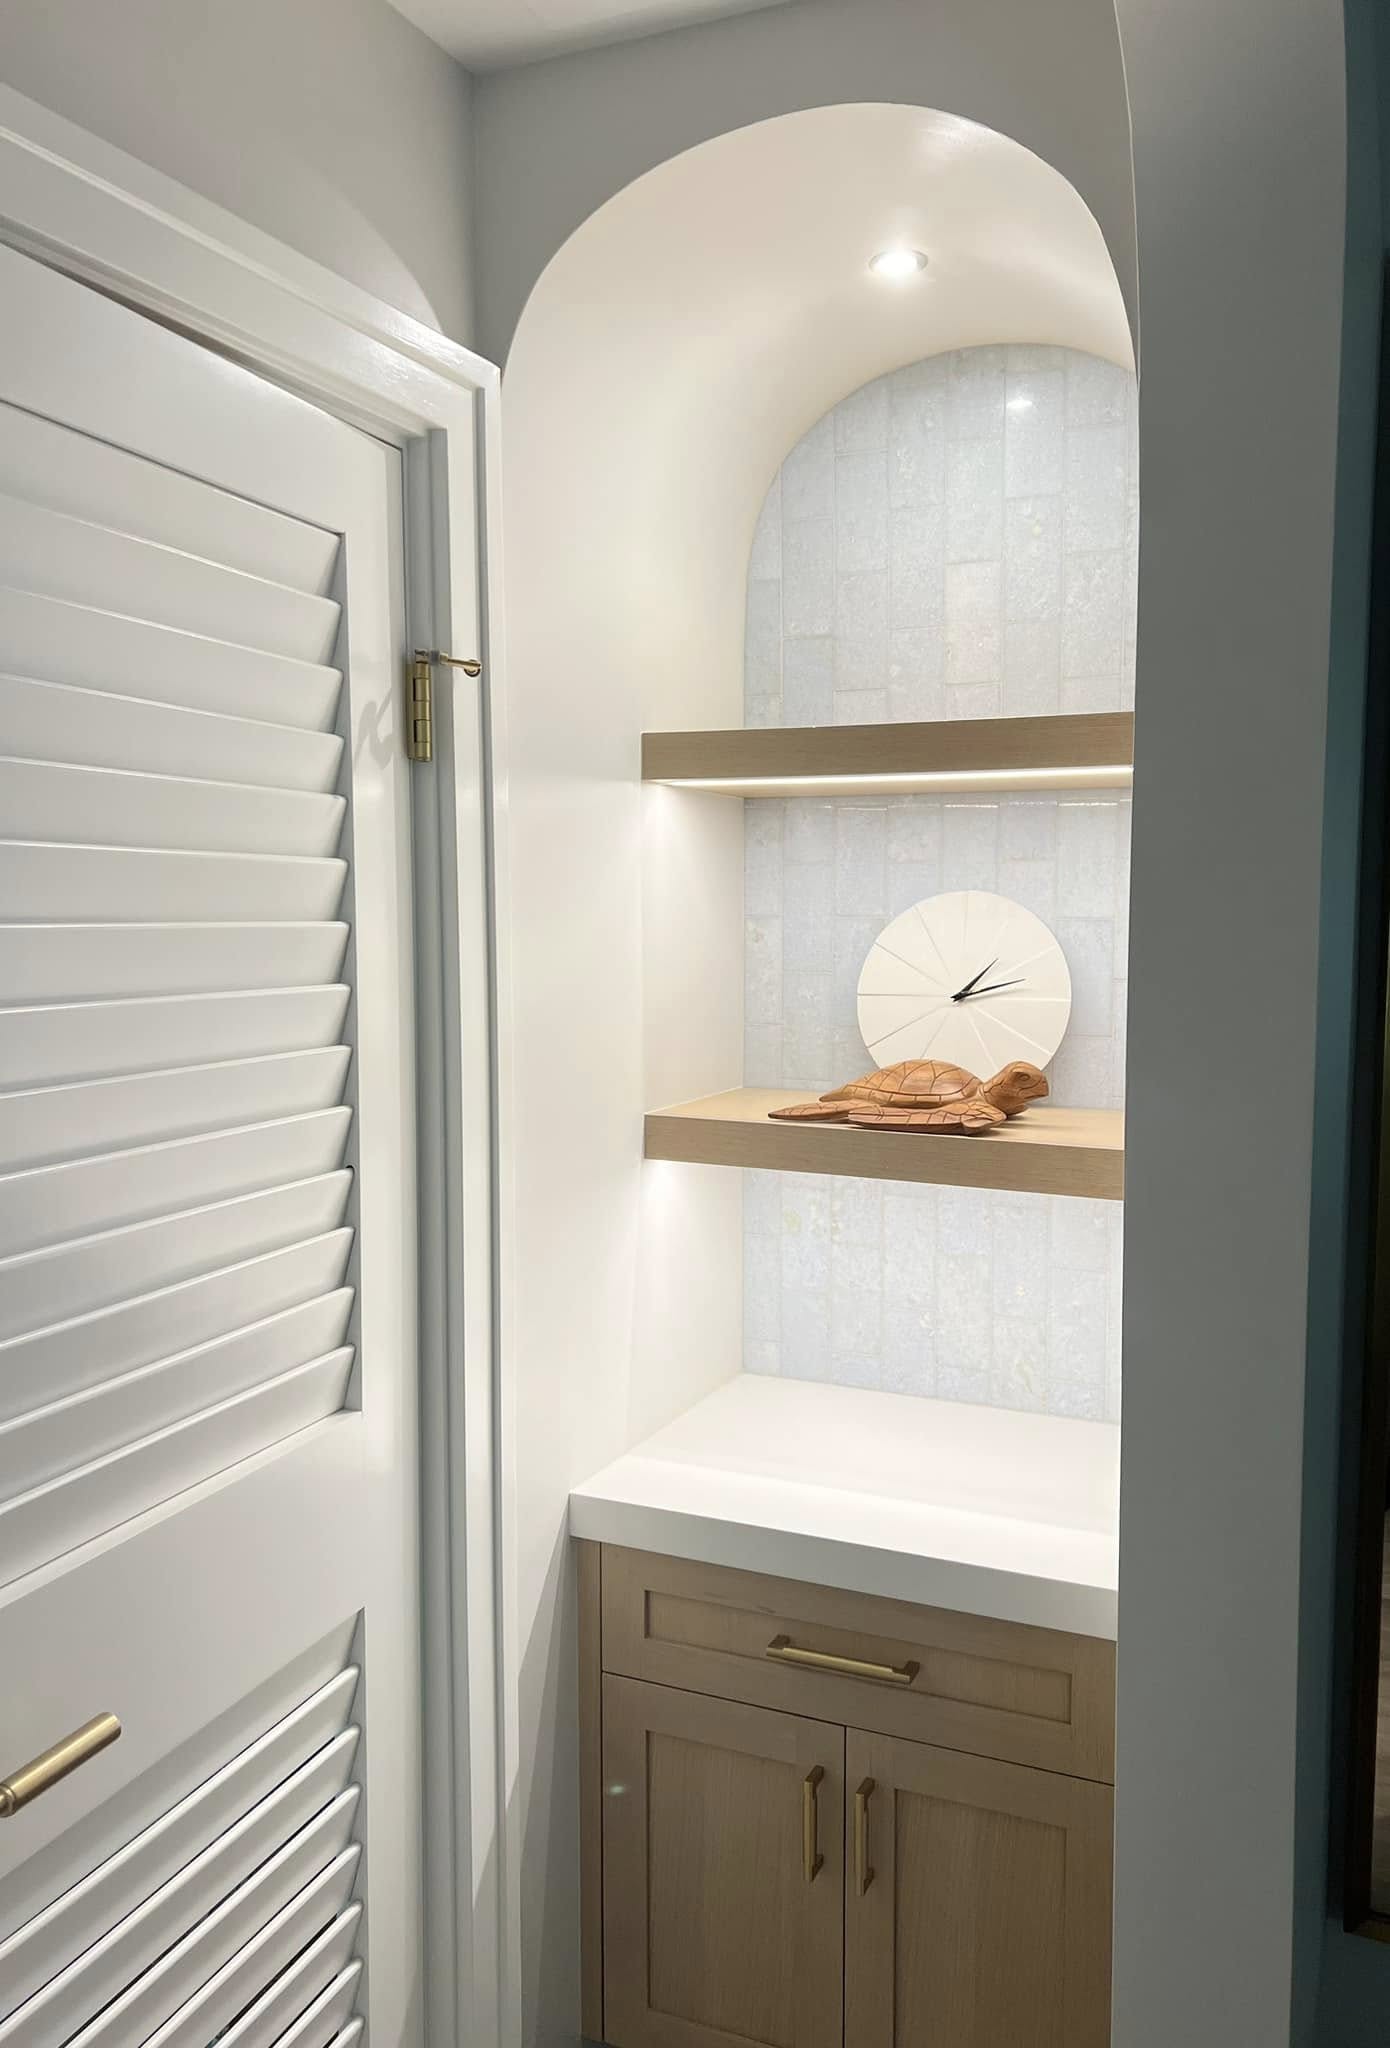
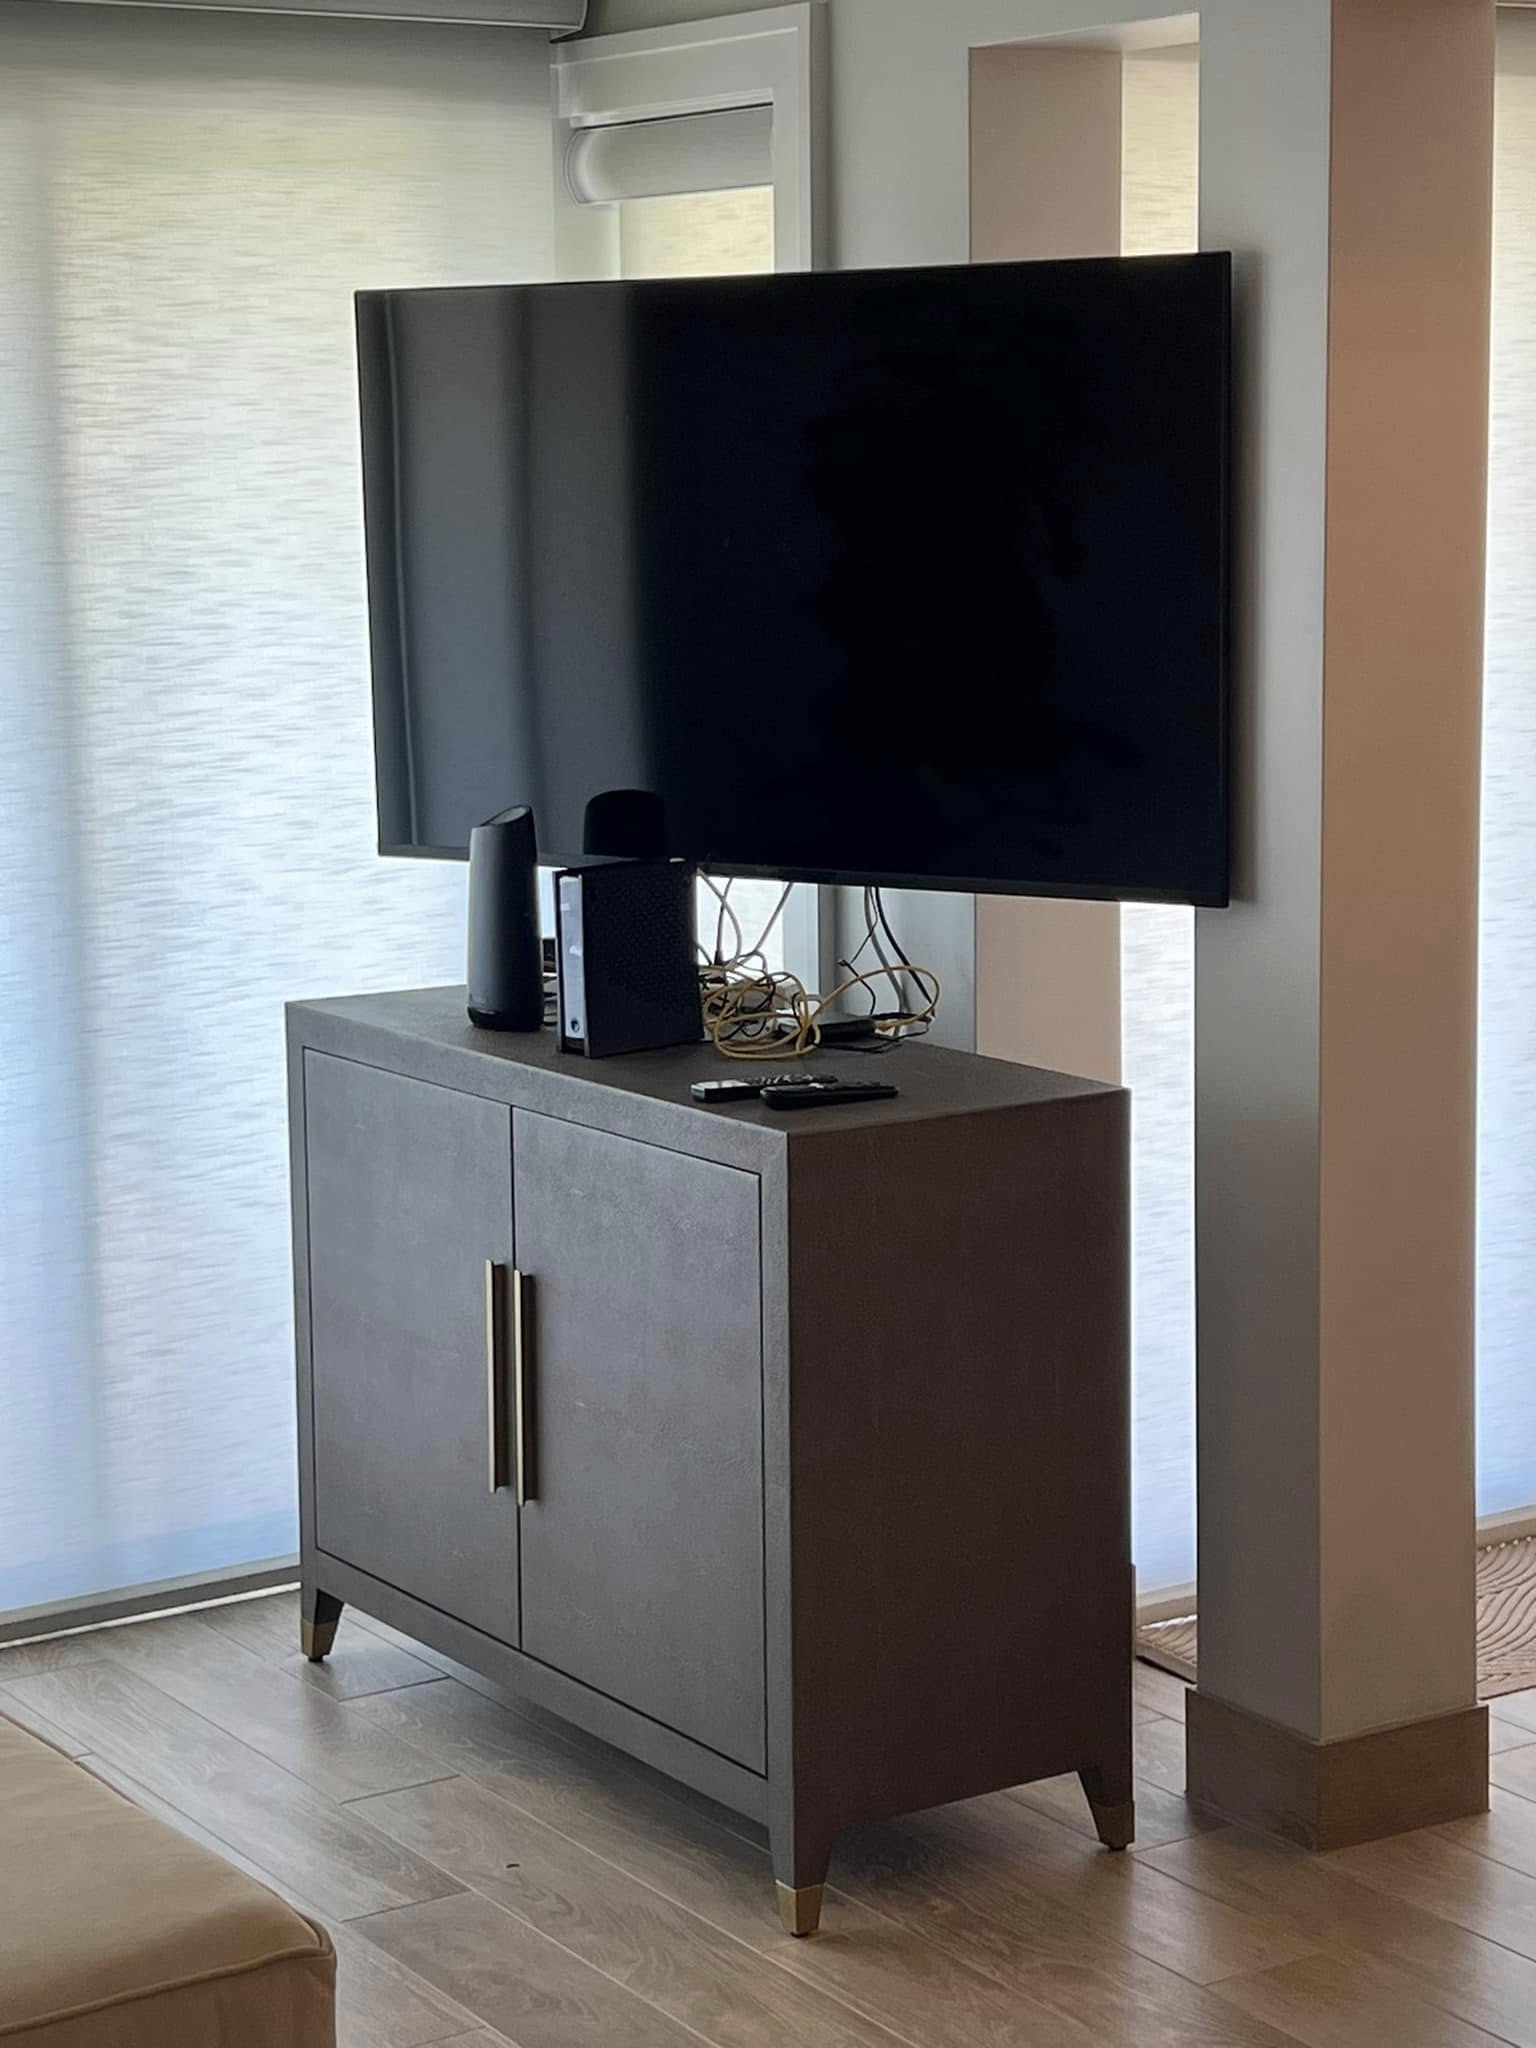
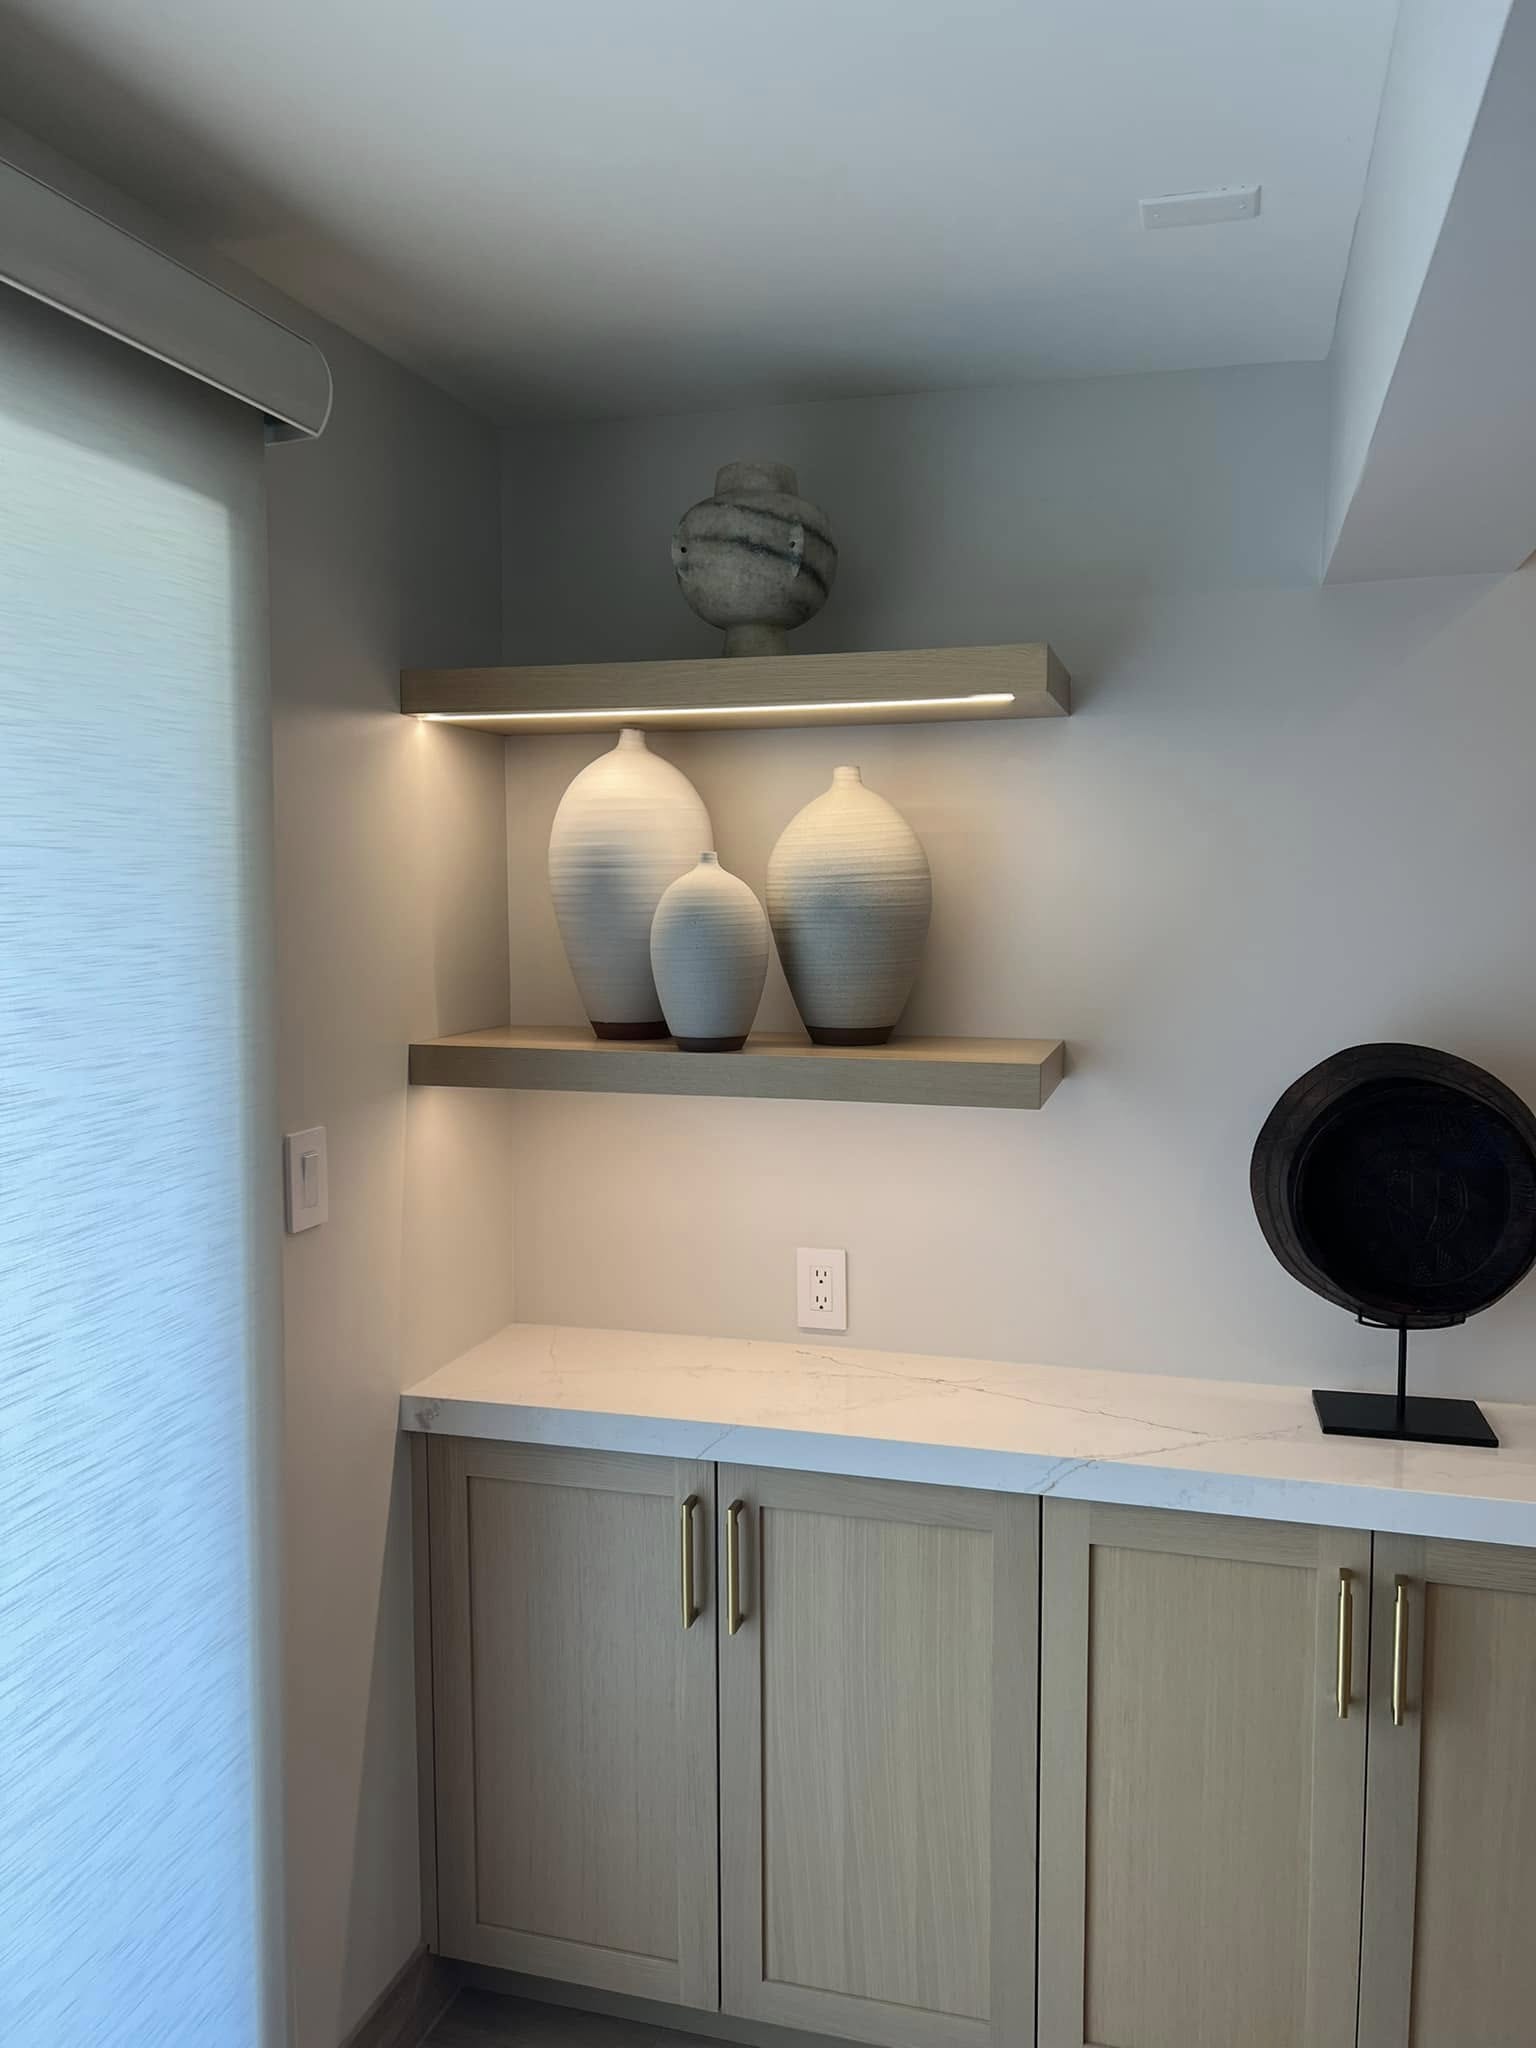
Same building. Same view. Same potential.
The two units share a wall. The ocean view is identical and the floor plan is mirrored. What you’re seeing on the right of each slider is what 22 P 3-4 becomes after renovation. The plan is to acquire the dated unit, bring it to the standard of the unit next door, and capture the value differential the next-door owners have already realized.
The proof isn’t a model. It’s the unit next door.
Most investment cases lean on projections. This one has a real comparable, sharing a wall with the unit we’re buying. Same building. Same ocean view. Same floor plan. The only meaningful difference is that one has been renovated, and one is about to be.
Unit 22 P 3-4
Dated finishes. Original layout. Renovation-ready.
- Same building, same view, same floor plan as the comp
- Structurally sound, recent systems upgrades (AC, water heater, plumbing)
- Renovation scoped to kitchen, living spaces, and both baths
- Bedrooms get hardwood floors, can lights, and a ceiling fan
- Whole-unit paint, new doors, defining arches, hall cabinetry
- Custom closet buildouts throughout
- 440 sq ft lanai: full flooring tear-out and replace
- Front steps refloored
The Unit Next Door
Same building. Same view. Fully renovated.
- Adjacent unit, shared wall
- Renovated to current luxury standard
- Real transacted price history, not modeled
- Establishes the post-renovation comp ceiling
*Modeled at full list price ($1,395,000) and the midpoint of renovation, closing, and furnishing ranges. If the unit is acquired at the $1.0–$1.2M negotiation target, all-in drops to roughly $1.3–$1.6M and day-one equity widens to ~$700K–$1M. Either way, equity is real on the day of close, not modeled.
A real trade history de-risks the model.
The 10-year wealth projection on this page rests on a conservative 5% annual appreciation assumption, below both the 40-year and recent Maui averages. The next-door comp adds a second, independent proof point: identical asset, transacted at $900K in 2018 and $1.9M in 2022, then renovated to a current market value of $2.2–$2.3M. The investment thesis doesn’t require Maui to keep appreciating to work. It works on day one if the renovated value of 22 P 3-4 approaches what the unit next door commands today.
The base case understates the likely outcome.
Every assumption in this model was chosen on the cautious side of the data. Three of the more material ones are worth naming out loud.
Appreciation is modeled at 5%.
Maui has averaged ~6.3% annually over 40+ years and ~8.4% over the past decade. At 6%, total wealth created over ten years rises to roughly $1.46M. The 5% baseline is deliberately below both historical averages.
Recent softness is a known shock, not a trend.
The 2-year price softness on West Maui reflects the 2023 Lahaina wildfire and the visitor pullback that followed. The market has been recovering. A 10-year horizon is used here precisely to absorb that shock rather than over-react to it.
Tax treatment is not included.
All figures shown are pre-tax. On a rental investment held this long, depreciation typically improves the after-tax return materially. We modeled the harder, more pessimistic number and left the tax benefit as upside.
Disclosure. Numbers should be confirmed against the unit’s actual rental history and any pending HOA assessments before closing. Rental income assumes short-term-rental rights continue. Projections are estimates based on stated assumptions and current market data; actual results will vary.
What about Bill 9 and the short-term rental rules?
It’s the question every Maui investor should ask. Here are the facts, the risk, and how the deal still works if the worst case lands.
Bill 9 phases out apartment-zone STRs.
Signed into law December 2024. Short-term rentals in apartment-zoned condos phase out by January 1, 2029 in West Maui and 2031 county-wide. Kapalua Golf Villas is currently on the State’s approved STR list (the “Minatoya list”), which the seller’s disclosure confirms.
Bill 88 creates a path to continue.
Passed by the Land Use Committee 6-1. Bill 88 introduces two new hotel zoning classifications that may allow thousands of units, Kapalua included, to continue as short-term rentals. The outcome is unresolved as of this writing, but the legislative direction is real.
Two confirmed rental years either way.
Working backwards from a July 2026 close and a six-month renovation, the unit goes to market around January 2027. Even in the worst case where Bill 88 fails and Bill 9 applies as written, the unit can be rented short-term through December 31, 2028. That’s two full years of the income modeled on the prior pages, plus the renovation, plus the appreciation captured.
Sell at the comp. Walk with the equity.
The worst-case exit is to sell the renovated unit at the $2.2–$2.3M comp ahead of the 2029 deadline. After two years of confirmed rental income, the value created by renovation, and the equity captured at acquisition, the investment still produces a profit. The asset value is in the building, the location, and the renovation, not in the right to rent it nightly. Bill 9 changes the income lane. It doesn’t erase the asset.

Your research assistant on this investment.
GiGi has been trained on every figure, assumption, and detail behind this opportunity. Instead of searching the page for an answer, just tap her on the shoulder and ask. She's available right now.
Ready for the conversation?
Deneé Sizemore is the investor on this acquisition and has been on the ground in Kapalua. She’ll walk through every line item, the renovation plan, the comp, and the partnership structure on your timeline.
Or just reply to the message you got from Denee. She’s expecting you.